Hot Dice Keep Rolling

The S&P 500 extended its winning streak to four months in June, rising 5.7% to mark its largest monthly gain since January. The MSCI All Country World Index rose 5.0% as strength broadened by sector and geography. Canada continues to buck the trend. The S&P/TSX fell 0.3% as utilities and healthcare dragged the index lower. Meanwhile, bonds resumed their weakness and stretched their run of losses to three-months. Two factors seem to be weighing on bonds; (1) selling ahead of the flood of issuance projected to hit the market following the resolution of the U.S. debt ceiling; and, (2) overall economic strength in the U.S. On 29-Jun-23, Q1 was revised up materially from 1.3% to 2.0%, annualized. Keep in mind GDP is reported net of inflation, so a 2.0% number is indicative of nominal growth over 6% given the Q1 inflation rate was 4.1%. Bond yields are a function of growth plus inflation. As such, yields have been pushed upwards which depressed bond prices. Additionally, strong growth in the face of sticky inflation will persuade the Fed to continue along its tightening path, further cementing the bear case for bonds.
Commodities were weak in June as the CRB index fell 0.1%. WTI oil led to the downside, falling 3.0% to the bottom of the range that has prevailed since December 2022. Oil was behind as much as 8% intra-month but a large inventory draw in the final week of the month allowed it to pare losses. In contrast, copper rose 5.8%. Copper is typically seen as a bellwether for global growth due to its industrial use case. The mineral’s coincidental rise with the GDP revision has created optimism for economic growth, a scenario that seemed unimaginable when the calendar rolled into 2023. China will need to overcome its economic malaise for global growth prospects to solidify and for a sustained recovery in industrial metals. Gold fell 1.4% as the upward pressure in yields negated any upside follow-through since it approached an all-time high in April 2023.
We commented last month that large cap technology stocks accounted for the vast majority of index gains year-to-date. The chart below highlights just how pronounced this has been, as the relative performance of each equity style factor is charted against the S&P 500. Whether you favour small caps, momentum, low volatility, or high dividend yields, each benchmark’s performance severely lagged the only style factor that mattered, growth.
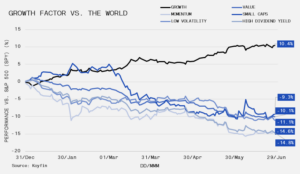
However, there was broader participation across all style factors in June. Although the gap hasn’t closed, the fact that the S&P 500 posted a comprehensive gain helps negate some of the concerns that 2023’s rally is based solely on optimism around artificial intelligence. From a flow perspective, we have seen some of the short bias in futures and options reverse in June, which can be an indicator that trend followers have begun to contribute. There were many who spent much of 2023 in historically high yielding cash instruments so fear of missing out will be driving further equity allocations. Most recently, Nasdaq’s CFTC futures and options positioning moved net long. We will watch closely for positioning to crowd on the long side as we gauge the likelihood of an approach to 2022 highs. For now, keep rolling.


Monthly Market Recaps
