
April 17, 2019
Yield Curve Signaling
First Quarter 2019 Newsletter
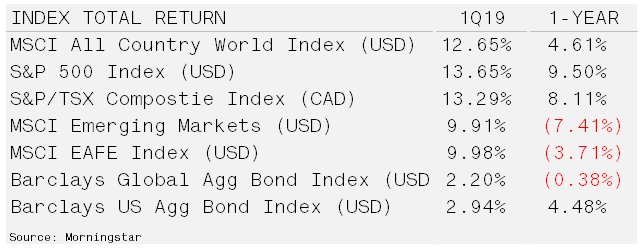
Markets Snap Back After Federal Reserve Pivot – While the fourth quarter of 2018 produced some of the worst data since the Great Depression, the first quarter of 2019 reversed that, posting its best start in nearly 20 years. Although the clouds around Brexit are still hanging over the global market, there is increasing optimism surrounding the US-China trade talks and a turnaround in the US Federal Reserve’s monetary policy stance. After stating interest rate hikes were on autopilot, Federal Reserve Chairman Powell reversed course with a rate hike pause and followed-up with news that quantitative tightening would come to an end by September. US equity markets continue to outpace global counterparts, although a higher dollar and wage cost increases will likely pressure corporate margins in the quarters to come.
US Treasury bond yields continued their descent, boosting returns to both high-quality and high-yield bonds. The all-important yield curve continued to invert during the quarter, with the 10-year Treasury bond yield falling below 3-month Treasuries.
Yield Curve Inverts Signaling Economic Slowdown – During the first quarter, 10-year Treasury yields fell below 3-month Treasury yields, inverting the yield curve. Curve inversions have preceded the past seven recessions. However, on 10% of the occasions, an inversion does not lead to a recession. So, what does an inverted yield curve actually mean?
The main yield curve reflects government bond yields across a time series that is as short as one day and extends out to 30-years. Front-end, or overnight, rates are set by the Federal Reserve while all other rates are determined by the market. The importance of these “risk-free” rates cannot be understated as they determine the price of all other asset classes.
When the front-end interest rate rises faster than the market-setting long-term rates, it impacts markets and the economy in two ways. The first is the impact on asset prices and the second is the effects on lending. The first impact is more intuitive, as the reward for holding cash rises, long-duration asset prices decline due to funds flowing into cash. Long-duration assets include both bonds and real estate as well as stocks, in particular growth equities which are priced as the present value of future cash flows.
The second impact takes a bit more explaining. As the yield curve flattens, this causes a strain on lending as well as the broader economy. Banks for example borrow on the front-end and lend at the long-end, when the curve is inverted the spread becomes negative. Less lending is almost assured to slow the economy and because this is reflexive – the slowing economy will beget more restrictive lending.
Tightening credit/liquidity is often felt in the riskiest areas of the economy first. This could explain the current flood of initial public offerings (IPOs) that are coming to market. Companies like Levi Strass & Co., LYFT, UBER and Pintrest are possibly raising capital in public markets because private markets cannot keep pace with liquidity needs or have no further capacity for financings.
Since 1965, however, the time between inversion and recession has varied significantly, ranging between 8 and 33 months, with an average of 19. A top in the US market has typically preceded recessions by only an average of seven months. Most of the stock market damage is incurred prior to the recession. The average peak-to-recession lost is -14.6%. Meanwhile, stock market performance during a recession is generally flat on average. Additionally, there have been two “head fakes” in which the curve steepened, and expansion continued. The 10% anomaly is perhaps upon us.
For investors with short-term needs for cash, the timing for taking profits in long-term assets is suitable especially given higher yields in short duration securities. For long-term investors, the yield curve inversion, should not be a signal to hastily dump stocks. Opportunity is becoming more apparent in value-based equities because these rely less on higher residual values.