
April 01, 2022
The Wall of Worry, Is It Different This Time?
First Quarter 2022 Newsletter
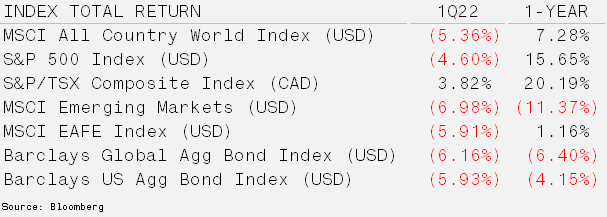
Bonds Face Worse Start to Calendar Year – March helped pull U.S. equity indices out of correction territory, defined as a peak-to-trough decline of more than 20%, as risk assets rebounded from a difficult start to the year. The key themes that dominated the market during the first quarter were inflation, rising rates and the conflict between Russia and Ukraine. With U.S. CPI reaching 7.5% and European inflation touching 5.8%, there is strong pressure for the Fed and ECB to tighten monetary policy, through higher interest rates mainly. While raising rates can keep inflation under control in a growing economy, today’s situation is less certain. Inflation appears to be increasing as a result of excess liquidity, supply chain disruptions and inadequate capital expenditures. Furthermore, the yield curve (interest rates over different time periods) has already flattened, which has in the past been a good predictor of a coming growth slowdown or even a recession.
The Wall of Worry, Is It Different This Time? – There are no shortages of bearish narratives these days in global markets. The central banks raising short-term interest rates to combat inflation, the very sad news of war in Ukraine, continued lockdowns in China and the flattening yield curve makes it difficult to maintain a positive outlook. Sentiment certainly reflects this with the AAII Investor Sentiment Survey showing optimism among individual investors falling to a level not seen in nearly 30 years. Positioning is also beginning to echo sentiment with Large and Small Traders lowering their exposures. This combination has placed the market at an interesting juncture.
With inflation hitting the wallets of consumers around the world, Central Banks use rate increases to combat inflation. In theory, rate increases should slow demand as borrowing costs increase. Thus less discretionary spending occurs. This in turn slows the economy, particularly in the U.S. where consumption makes up the lion’s share of gross domestic product. A bit surprising, is the fact that stocks typically perform reasonable during the rate increase cycle. Over the last 12 rate hike cycles, Truist Advisory Services found the S&P500 posted a total return at an averaged annualized rate of 9.4%, showing positive returns in 11 of those periods.
This cycle naturally has its own nuances, in addition to having just injected the economy with the most capital ever outside of the World Wars, the world now faces the possibility of energy and food shortages due to the war in Ukraine. Higher energy prices played a significant role in the 2008 recession with prices going parabolic. Higher hydrocarbon prices not only impact corporate margins through raw material prices, it also slows demand for travel. But it is not just higher input costs crimping margins, wages are increasing as corporations attempt to lure people back into the job market. Declining margins have historically led to lower valuations.
A zero COVID policy continues to be implemented in China. The difficulty of managing locking down cities with 26 million people has become more evident as there are reports of food shortages and riots. Here in North America, supply chains are facing their largest challenges to date as factories and ports in China are shut down. This is coming at a time of already slowing earnings growth and putting further pressure on margins. The most severe of the impacts will begin to take place during the second quarter and extend for six to 9 months.
The yield curve, which maps the interest rate over different durations, has already inverted. This has a history of occurring just prior to recessions. While equities have indeed been spooked by the flattening, there are structural forces at play in the market causing yields to spike, particularly on the short end. With sentiment recognizing this, we anticipate a number of sharp rallies as volatility will remain high. During the 2000 bear market, there were 16 rallies by the NASDAQ that were greater than 10%, averaging just over 22%.
Therefore, with news flow, economic data and forward indicators pointing to more market downside, our preference remains to seek out quality investments, while remaining nimble to capture sharp rallies.