
March 26, 2020
Just when you thought it was safe to go back in the water
Market Recap & Box Score
Despite providing our last market update just ten days ago, we wanted to offer a recap of the events as governments have implemented measures to protect the economy and maintain order in the financial markets.
Here is the good news … on 25-Mar-20 the US announced a $2.2 trillion fiscal stimulus package, helping citizens through direct payments and unemployment benefits, while also supporting small and large businesses through access to credit. These measures were delivered after the Fed cut rates to zero and announced a $700 billion quantitative easing program. To help ease corporate funding, the Fed restarted its commercial paper funding facility, indirectly purchasing short-term obligations to lower funding costs. In addition, the Fed announced a plan to increase Treasury purchases, and more importantly, expand their planned products to corporate bonds and the ETFs that hold investment grade issues. So far it seems that the market has appreciated the efforts.
From its bottom on 23-Mar-20, the S&P 500 has appreciated 20%. Accordingly, March 2020 has produced both a bear market and bull market! The TSX rose 19.5% from its low. Despite this strength, the S&P 500 and TSX are down 19.3% and 21.6% year-to-date.
Rates have been equally entertaining. The 10-year US Treasury Yield fell from 1.91% on 31-Dec-19 to 0.50% on 09-Mar-20. The sinking long-dated rate reflects the slowing economy. The significance of the deceleration is amplified when one considers that the yield was 3.20% in November 2018. At the time of writing this brief, the yield rebounded to 0.74%.
The flow of investment capital has been a significant contributor to the market volatility. Many large players like relative value strategies, hedge funds, and commodity trading advisors (CTAs) reduced their exorbitant leverage and/or moved from a net long to a net short bias. This indiscriminate selling to lower their exposure and leverage impacted the benchmarks to the downside. It seemed like most of this forced selling was complete late last week. But then another large player entered the mix. The end of March is rebalancing season for pension plans. US pensions maintain an equity bias due to their overly aggressive 7%+ return targets. This means that after a 25-30% selloff in equities, they must purchase more stocks to bring that content back to a prescribed level. Accordingly, pensions need to sell Treasury Bonds to finance the stock purchases. Goldman Sachs estimates that this quarter will be the largest dollar value of pension assets moving into equities on record (second to Dec-18), requiring $280 billion of purchases during the final week of the month.
Covid-19 is still in its relative infancy in North America. Trump’s “Back-to-Work-by-Easter” pledge may put some at ease as it relates to the short-term economic impact of the virus. However, we fear that the human and healthcare toll will be dreadful if this promise is fulfilled. It still does not seem that the US population is taking the threat seriously, especially given the country’s high incidence of diabetes, obesity and hypertension, relative to the Asian nations that were originally exposed to the virus. In addition, the US just reported that an astonishing 3,300,000 workers filed for unemployment last week, a number that was more than twice as high as consensus estimates. If Covid-19 infections accelerate exponentially, unemployment will swell, consumer spending will grind, and business activity will stall further. A potential corporate default cycle could ensue which would render the prospect of a V-shaped recovery a fantasy.
There are two primary factors that have influence over our willingness to increase growth assets materially in our portfolios: a sustained recovery in credit and a fall in volatility.
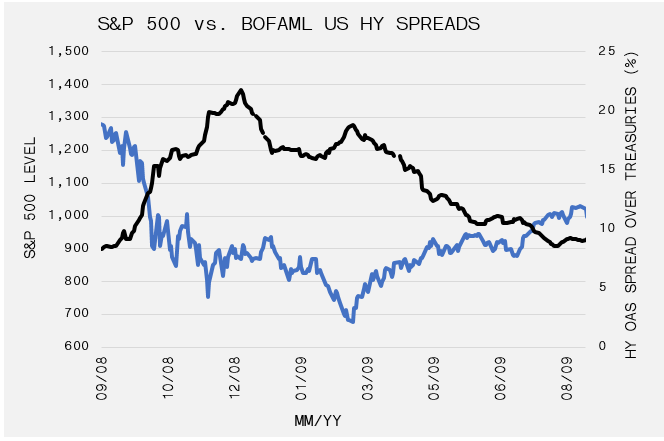
Often credit leads the way in a recovery. In the embedded chart, yields (represented by the black line) begin to fall late in 2008, a full four months before equities. The S&P bottomed after a further 24% slide. Currently high yield spreads, as measured by ICE BofAML US High Yield, are 10.11%, up 6.45% from the February low. This level has not been seen since June 2009.
Volatility, as measured by VIX, remains above 60, which implies that there is no end in sight for these large market swings. Humans are loss-minimizing creatures by nature, meaning the pain experienced by a loss far-exceeds that of a gain. Therefore, a continuation of high volatility suggests that uninterrupted equity market gains are not imminent. We would prefer to see both yields and volatility come down in a sustained manner before believing the three-day rebound is anything more than a bear market rally which are prevalent across almost all historical selloffs.