The 2022 NHL Entry Draft will be held on July 7–8, 2022, at the Bell Centre in Montreal. Great timing for us to share some tips for young players and investors. Investing isn’t about earning the highest return, it’s about earning a reasonable return given the risk you are accepting and repeating the return consistently and for a long period.
Smart Money
Our regular summary of the capital markets. Check back each month for new updates.

July 29, 2022
Mid-Summer Relief
Market Recap & Boxscore
A rally in the back-half of July propelled stock market indices to a positive month. The MSCI World led the way, up 5%, while the S&P 500 followed with a 4% return. The TSX lagged, with a gain of under 1%, as the heavy weight in Financials and Energy slowed the year-to-date leader. Interestingly, it was the year-to-date losers that guided the S&P 500’s 11% rally off its June l...
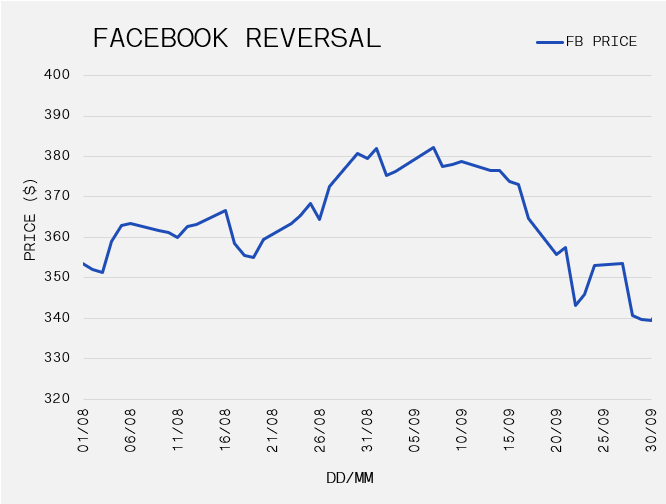
A rally in the back-half of July propelled stock market indices to a positive month. The MSCI World led the way, up 5%, while the S&P 500 followed with a 4% return. The TSX lagged, with a gain of under 1%, as the heavy weight in Financials and Energy slowed the year-to-date leader. Interestingly, it was the year-to-date losers that guided the S&P 500’s 11% rally off its June low. Consumer Discretionary and Tech stocks registered gains of nearly 12% and 10%, respectively. The sole outlier was Communications as Meta Platforms Inc. produced quarterly results that once again disappointed across almost all metrics. The company, formerly named Facebook Inc., accounts for 24% of the Communications sector.
Commodities continued to weaken in July. Corn fell over 19% and WTI oil and copper dropped 13.4% and 7.9%, respectively. Gold slumped 3.9% during the period. However, real rates and the U.S. dollar faded into month-end, allowing gold to rebound 4% off its July bottom.
About half of the S&P 500’s constituents have reported Q2 results. It was feared that earnings would fall far short of analyst consensus estimates. However, panic has not materialised. Refinitiv reported 69% of companies beat expectations. Moreover, the reaction to company results has been an important difference from prior quarterly reporting periods. For instance, Microsoft Corp. and Alphabet Inc. both reported revenue and earnings that fell short of expectations. Nevertheless, their share prices popped 7% and 8%, respectively, on the day. This is in stark contrast to the relentless selling that greeted even strong earning reports earlier in 2022.
Continuing on the topic of counterintuitive follow-throughs, U.S. GDP fell 0.9% in the second quarter, which followed a 1.6% decline in Q1. Agreement on the definition of a technical recession is contentious. However, it is undeniable that the economic landscape is far from rosy given the clouding job picture and two consecutive negative GDP prints. Despite the GDP report on 28-Jul-22, stocks failed to give back any of the outsized gains that accrued following the Fed’s announcement of a 75bp rate increase a day earlier.
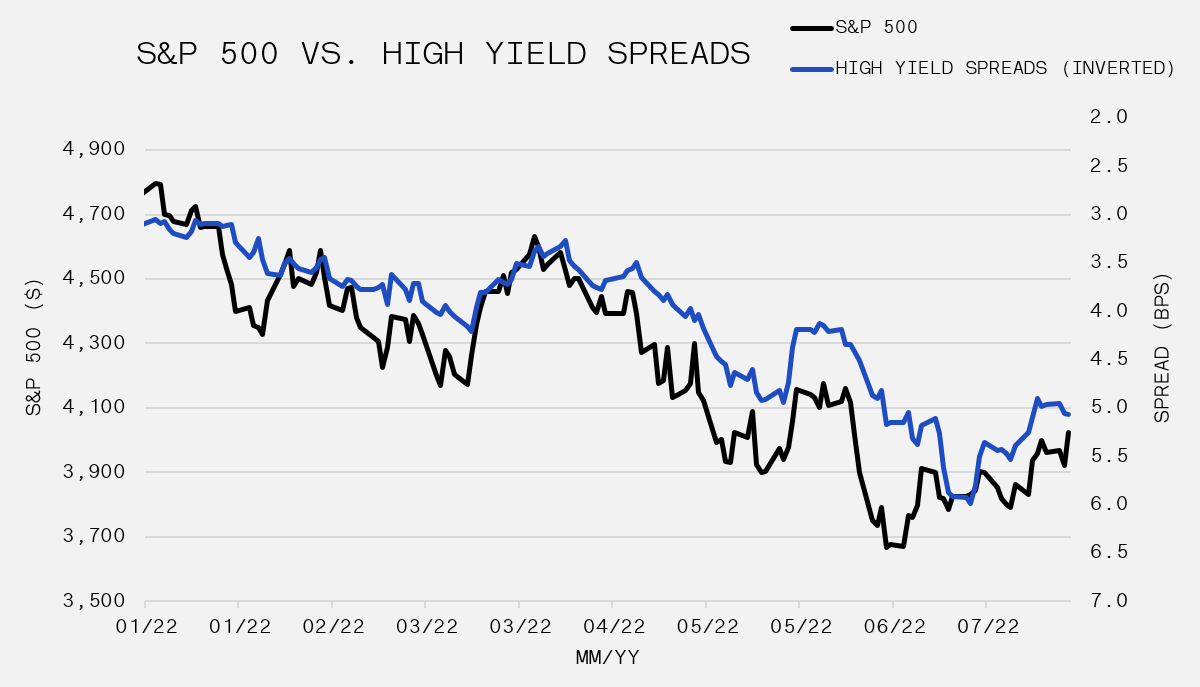
In our previous Monthly Recap, we commented about the profound weakness in the equity markets to start the year. In consideration of the first half bust, the outsized short position in S&P 500 futures and the low level of gross exposure among hedge funds, it is not overly surprising that stocks rallied in the face of negative economic news. Time will tell whether this is simply another aggressive bear market rally or if the bounce is more durable. For insight into the possible market direction going forward, there are three key indicators that require constant evaluation (i) the U.S. Dollar, (ii) credit spreads, (iii) the yield curve. The USD, represented by the DXY, is a key measure as it gauges the Federal Reserves determination for fighting inflation and it acts as a safe haven in times of stress. It rose another 2% in July, though it backed off 3% from the high on 14-Jul-22. The yield curve became negative during the month. The short end of the curve is lifted due to the Federal Reserve rate hikes while the bond market anticipates an economic slowdown and lowers bond yields on the long end. Despite the strong dollar and the recession signal, credit spreads tightened which typically suggest a willingness to take more risk and potentially improving economic conditions. The ICE BofA US High Yield OAS contracted from 5.26% to 5.07%. One month does not make a bull market, but there is an opening for additional upside, if the USD softens more and the yield curve re-steepens.
July 15, 2022
How Did We Get Here?
Second Quarter Newsletter
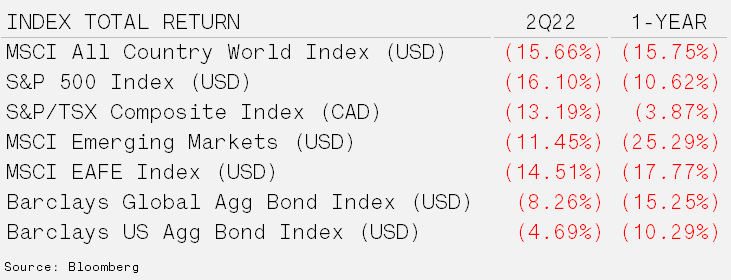
Brutal Quarter Confirms Bear – The S&P 500 entered bear market territory during the quarter, falling 16.1%. Mid-way through June, the benchmark was down as much as 24% from its peak. Persistently high inflation, leading to a hawkish (less accommodative) Federal Reserve combined with an economic slowdown were the drivers behind the weakness. The commodity-heavy S&P/TSX Composi...
Brutal Quarter Confirms Bear – The S&P 500 entered bear market territory during the quarter, falling 16.1%. Mid-way through June, the benchmark was down as much as 24% from its peak. Persistently high inflation, leading to a hawkish (less accommodative) Federal Reserve combined with an economic slowdown were the drivers behind the weakness. The commodity-heavy S&P/TSX Composite fared much better. However, in the back-half of the quarter, the sectors that were supporting the Canadian index faltered as oil and gold prices lost momentum.
The performance of bonds has been perhaps the more concerning development over the quarter and really the last year. These typically “low risk” investments registered double-digit losses over the trailing 12-months. Late-cycle behavior continues to unfold with wider credit spreads and an inverted yield curve.
The Seven Sins of Inflation – Inflation is a rise in the average cost of goods and services over time. Financial markets measure inflation through the Bureau of Labor Statistics, which compiles data to determine the Consumer Price Index (CPI). The average rate since the Second World War is 3.76%. However, the 10-year moving average is just over 2%. In June, CPI touched a 40-year high of 9.1% year-over-year. Although we continue to believe that structural forces remain in place that make it difficult to maintain a level greater then 4%, it has been the combination of these seven forces listed below that lead us to where we are today. The first two are more long-term in nature and give us the most to think about while the others are supply side shocks, corporate greed, and geopolitical events.
– (1) Rising labour costs in China due to a shrinking working age population and increasing Gross Domestic Product per capita.
– (2) Political forces and capital allocation that favours Environmental, Social & Governance (ESG) have led to under-investment in conventional energy sources.
– The global pandemic of 2020 is responsible for three contributors to the rising inflation prints; (3) trillions of dollars spent in relief packages in the United States, (4) labour shortages as workers left the labour force and (5) supply chain disruptions.
– Public equity valuations are driven primarily by revenue growth and profit margins. Corporations have relied on (6) price increases to stabilize margins to offset rising labour costs and raw material expenditures.
– Finally, (7) the Russian invasion of Ukraine had a direct impact on energy and food prices. Sanctions against Russia removed oil and natural gas supply from the global market at the same time blockades have trapped corn and wheat in one of the world’s largest producing regions.
The factors combating these inflationary forces are mainly structural. The level of national debts, aging populations and a stronger U.S. dollar should alleviate some of the upward pressure on inflation over the long-term. However, it does not appear that we will quickly return to the often cited 2% level of inflation. National interests are now at the forefront of geopolitics. As such, the ESG, supply chain and rising cost concerns overseas have raised awareness of domestic dependence on globalization.
For today’s investors, inflation is vastly outpacing cash savings. Prices double every 19 years based on the post-WWII average inflation rate (3.76%). As a result, protection against the loss of purchasing power for long-term investors is paramount.
Fixed income investments were designed to provide real returns (returns after accounting for inflation) but over indebtedness and lower growth have suppressed long-term yields. Stocks have a mixed track-record when isolating inflationary periods, but in general have held up well. Public market sectors tied to natural resources and real assets have performed the strongest, along with real estate. GAVIN attempts to accumulate these assets during periods of below average inflation when the risk/reward is skewed in our favour. This includes our farmland participation, private and public real estate strategies and commodity investments.
July 07, 2022
Retiring at 28
Smart Money
If the players who were drafted in 2012 started their NHL careers when the lockout ended in 2013 and continued to play in the league through the conclusion of last season, they would have maximized the NHL pension benefit. The top 5 picks in 2012 were Nail Yakupov, Ryan Murray, Alex Galchenyuk, Griffin Reinhart and Morgan Reilly. The age of these players is 28 years old. As we look fo...
If the players who were drafted in 2012 started their NHL careers when the lockout ended in 2013 and continued to play in the league through the conclusion of last season, they would have maximized the NHL pension benefit. The top 5 picks in 2012 were Nail Yakupov, Ryan Murray, Alex Galchenyuk, Griffin Reinhart and Morgan Reilly. The age of these players is 28 years old. As we look forward to this week’s NHL Entry Draft, we also want to celebrate the players who accumulated the maximum NHL pension credits with the completion of the 2021-22 campaign. Accordingly, we summarized the defined benefit pension program’s facts and features in the link below. Good luck to the players available in this week’s draft and congratulations to those who have achieved their maximum pension!
June 29, 2022
S&P500 on Track for its Worst First Half in Over 50 Years
Market Recap & Boxscore
The rally across equity markets in the back half of May was quickly erased in June, as the S&P 500 fell approximately 7.5% to bring its year-to-date drop to the 20% range. June weakness was notable as this was the first month in 2022 where there really was nowhere to hide for equities, as even the energy sector fell nearly 15%. This led to a sizeable drop of about 8.5% in the TSX,...
The rally across equity markets in the back half of May was quickly erased in June, as the S&P 500 fell approximately 7.5% to bring its year-to-date drop to the 20% range. June weakness was notable as this was the first month in 2022 where there really was nowhere to hide for equities, as even the energy sector fell nearly 15%. This led to a sizeable drop of about 8.5% in the TSX, which has been a consistent leader throughout the year. The MSCI ACWI split the difference, tumbling closer to 8%, as European equities failed to provide any strength. The only clear winner this period was China, with the Shanghai Composite Index rising over 7% as policymakers initiated a monetary easing cycle.
The mighty commodity trade sold off as the CRB Commodity Index crumbled 6%. Copper led the way down (almost 12%), gold fell 2% and WTI oil slipped roughly 1.5%. Bonds were once again correlated with equity markets. Barclays Aggregate Bond Index took a 3% beating on the back of 10-year yields rising 28bps to 3.125%. High yield as measured by HGY dived over 8% due to the combination of increasing rates and widening high yield spreads.
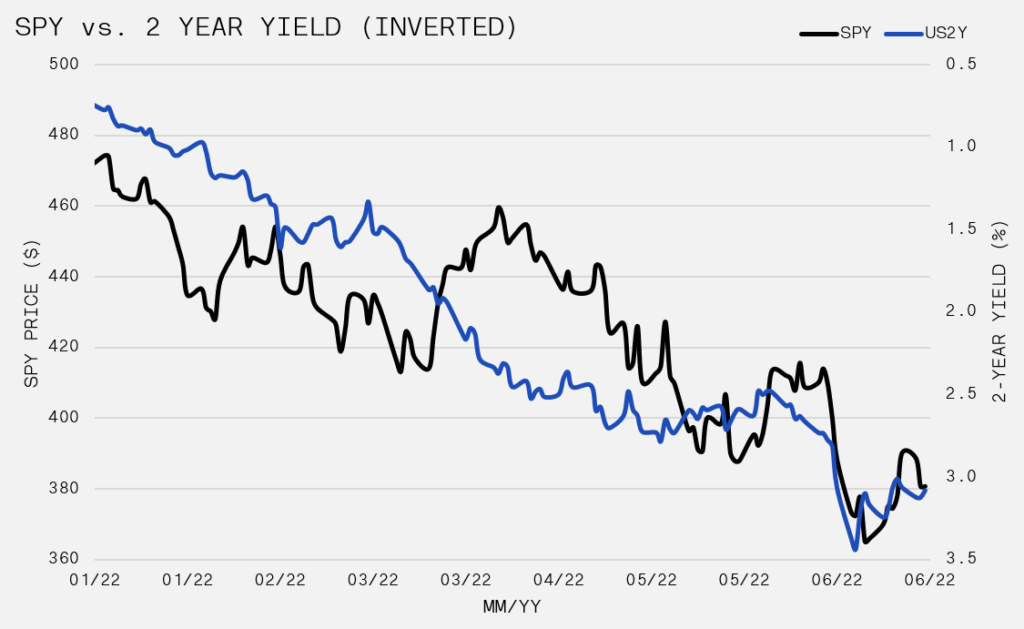
Equity direction has clearly been a product of the Fed policy, as the S&P 500’s descent has been strongly correlated with the inverted 2-year yield (see the image below). The market is pricing an increasingly aggressive Fed hiking cycle, which has pushed rates up across the curve, but particularly at the short end. After a “surprise” 0.75% hike on 15-Jun-22, Fed Chair Powell stated that the Fed’s focus will shift from an employment mandate to an inflation fighting mandate. Further, the underlying aim will move from core inflation to headline inflation. The major difference is that headline inflation is primarily an energy gauge. As such, the Fed will need to continue its fight against price increase as long as energy and its products become more expensive. This is obviously not good for financial assets that are priced off the risk-free rate. The other obvious risk to equities is a recession. According to the Bureau of Economic Analysis, real gross domestic product (GDP) decreased at an annual rate of 1.5% in the first quarter of 2022. Further, the Atlanta Fed dropped its second quarter estimate for growth to 0%. A recession is commonly defined as an economy that shrinks for two consecutive quarters. As a result, cynical forecasters are becoming increasingly confident.
But, now for the good news, if commodities are in fact in the process of topping, inflation pressure should begin to ease. In fact, easing price pressure was reported in the Core PCE (personal consumption expenditures) Index. This narrower measure of inflation that omits volatile food and energy costs, rose by a modest 0.3% in May.
It’s important to respect just how weak equities have been to start the year. Since the market is forward-looking, lowered inflation expectations and a less aggressive Fed, could ignite a rebound. Nevertheless, a bounce could be short-lived, if it turns out that hiking rates only serves to further curtail supply which induces more scarcity and price tension. In this instance, the Fed will have sacrificed employment in favour of a losing inflation policy that only pushes the economy further into recession. Accordingly, acknowledging all outcomes along the probability curve continues to be of utmost importance.
May 30, 2022
Stocks and Bonds Embark On a Skeptical Recovery
Market Recap & Boxscore
The calendar month is not officially over, but as of the U.S. Memorial Day holiday, it looks like the S&P 500 will close the month out with a 0.7% gain. The profit was achieved with a 6% boost in the final week, ending a 7-week losing streak and marking the index’s best one-week advance since the first week of Nov-20. The MSCI World managed to lead with a 0.9% improvement, paced b...
The calendar month is not officially over, but as of the U.S. Memorial Day holiday, it looks like the S&P 500 will close the month out with a 0.7% gain. The profit was achieved with a 6% boost in the final week, ending a 7-week losing streak and marking the index’s best one-week advance since the first week of Nov-20. The MSCI World managed to lead with a 0.9% improvement, paced by continued strength in Europe, while the TSX lagged, down 0.5%. Looking deeper, excluding energy, strength was concentrated in names that were hit hardest to start the year as consumer discretionary and technology led the way. However, energy fared just fine, up 8.3% during the month which marked an impressive 59.5% year-to-date increase for the sector. This compares to consumer discretionary which is down 24.7%. For those new to this, an 84% year-to-date spread between the top and bottomer performer is truly impressive. The turnaround in equities occurred around the time that the US Federal Reserve released its meeting minutes. The commentary was interpreted as an indication that the central bank will be less aggressive going forward. Our sense it that equity hedges were covered following the announcement. As such, the narrative fits the price action but expectations for a pause in the tightening cycle may be premature.
It wasn’t just stocks that managed to gain a bit of traction in May as the bond market turned in a strong month. The 10-year U.S. Treasury yield fell 0.20% to 2.74%, providing some reprieve for a traditional 60/40 portfolio which has suffered to start the year. U.S. high yield corporate bonds were also bid in May. The iShares iBoxx High Yield Corporate Bond ETF rebounded 2% after losing more than 10% in the first four months of the year.
Not a lot has changed with the broad bull market in commodities. Energy continued to lead the way with natural gas and WTI oil rising 21% and 12%, respectively. The agriculture complex was mixed as wheat rose 10% while corn fell 5%. Federal Reserve Chairman Jerome Powell identified the rapid rise in commodity prices, incited by Russia’s war, as an accelerant for inflationary pressures across the economy. Accordingly, a reversal in the sector will be helpful to fulfill the “less hawkish Fed” storyline.
Gold fell 3% during the period. A 4% bounce off its mid-month low helped minimize its weakness. We are starting to see signs of slowing growth in inflation and economic data, which may be supportive of gold. The U.S. dollar (USD) also seems to be sniffing this out as the DXY fell 2%, just after futures traders started piling in on the long side of the trade. If a pullback in the USD is maintained in the coming weeks, we could start to believe the rally in stocks. North of the border, the Loonie recoiled off the low-end of its recent range and rose 2% against the Greenback. The Bank of Canada will make its monetary policy announcement 01-Jun-22. The aggressiveness of its rate hike will draw attention especially since housing affordability is one of the top issues facing Canadians.
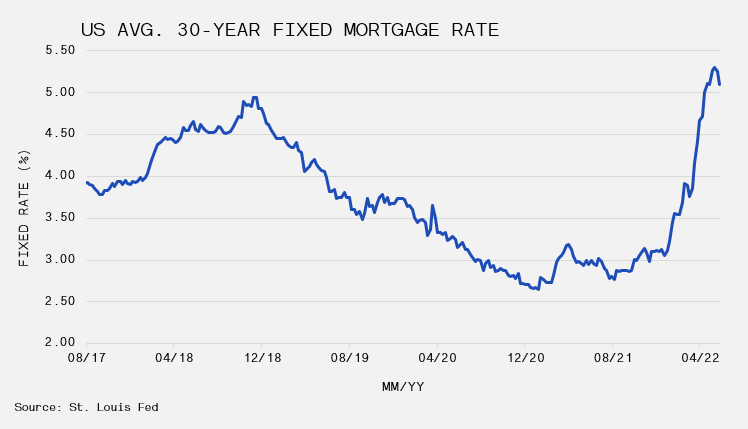
Consumer spending habits remain levered to the value of their home; as such, the prominence of price trends in the housing market cannot be overstated. With yields taking a pause, 30-year fixed rate mortgages in the US fell to 5.1% from 5.3% in mid-May, providing a much-needed pullback. Mortgage rates have risen rapidly since the start the year. This modest turnaround was well received as new home sales in April missed estimates by 21%., which pushed inventories higher by 8.3%. The housing picture remains bullish from a demographic’s perspective but expanding supply will weigh on the outlook. Homebuilders welcomed the rate pullback, as iShares US Home Construction ETF rose 6% in May, helping to trim the 32% drop to start the year.
May 01, 2022
Changes in Player Compensation
Smart Money
In July 2020, the NHL and the NHLPA agreed on an extension of the Collective Bargaining Agreement (CBA). The settlement added six seasons to the existing terms and promised hockey fans uninterrupted action through 2025-26. The extension provided players with increased visibility on salary figures, which include items such as entry-level contracts, individual/team bonus amounts, salary...
In July 2020, the NHL and the NHLPA agreed on an extension of the Collective Bargaining Agreement (CBA). The settlement added six seasons to the existing terms and promised hockey fans uninterrupted action through 2025-26. The extension provided players with increased visibility on salary figures, which include items such as entry-level contracts, individual/team bonus amounts, salary limits and, most notably, escrow withholdings. Click the link below to review upcoming changes!
April 28, 2022
Markets Bruised After Brutal April
Market Recap & Boxscore
Last month’s rally in equity markets quickly faded in April as aggressive and persistent selling led the S&P 500 and MSCI World indexes to declines of 7%. Even the TSX, which has defied gravity in 2022, fell 4.3%. Under the hood, the flight to safety accelerated with markets favouring staples, real estate and utilities, while selling discretionary, technology and financials. Unlik...
Last month’s rally in equity markets quickly faded in April as aggressive and persistent selling led the S&P 500 and MSCI World indexes to declines of 7%. Even the TSX, which has defied gravity in 2022, fell 4.3%. Under the hood, the flight to safety accelerated with markets favouring staples, real estate and utilities, while selling discretionary, technology and financials. Unlike earlier in the year, downside participation by large cap Generals contributed to the weakness during the period. Index-dominating names like Google and Apple crumbled over 16% and 8%, respectively. We always keep a close eye on credit markets to confirm a move in equities. Yields across corporate bonds persistently marched higher, and spreads, as measured by the BofA US High Yield Index OAS, rose 51bps to 3.89%. The trend in credit spreads is notable, but we are not yet at levels of excess stress.
Commodities did not cooperate with the decisive downward moves in equities and bonds. The results were mixed across the broad asset class, but collectively their winning streak extended for a fifth month. Gold head-faked another breakout, turning around and ending down 3.1% for the month. Oil swung for the fences, reaching +15% before settling at a 5.1% boost. Elsewhere, natural gas resumed its levitation trick, rising 23.4% as abnormally cold weather and supply issues emanating from Europe pressured supply. The agricultural commodities were positive as drought concerns and early indications of poor crop quality in the US led to gains of about 7% across the complex.
The uninterrupted upward move in bond yields carried on in April. The US 10-year yield increased 50bps to 2.86%; 2-year yields rose 33bps to 2.64% – an indication that an aggressive Fed will persist throughout 2022 and 2023. Equity drawdowns are logical given experience during periods of heightened economic uncertainly but the degree of weakness in the bond market has few comparables. The Bloomberg Aggregate Bond Index has slumped almost 9%. In fact, one would have visit the late 1970s to find a comparable decline for the index.
The U.S. Dollar continues to be a global wrecking ball in currency markets. The DXY strength was previously a function of its heavy weighting to EUR and JPY which were both faltering. However, in April even the mighty Canadian dollar fell 2.3% while the British pound fell 5.2%. Both the USD and yields have an outsized impact on corporate profitability so these factors will become more prominent in the evaluation of future earnings.
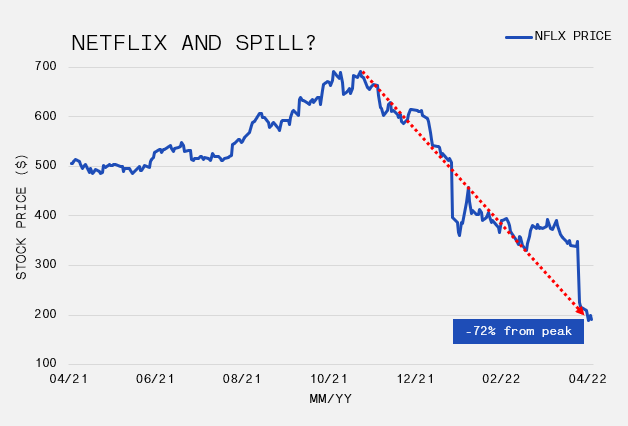
With a new quarter came the start of Q1 earnings season, and so far on aggregate we are seeing results that leave something to be desired. Probably the biggest surprise were the results from Netflix, which left the stock down 35% on earnings day, about 50% for the month and over 70% from its peak in November 2021. The carnage occurred despite beating on earnings and matching revenue expectations. However, investors keyed-in on a drop in global paid streaming subscribers as a sign of competition eating into the aggressive growth expectations that were baked into the stock’s price.
From a macro perspective, US GDP came in well below the estimated 1% growth rate in Q1, falling 1.4%. Upon further investigation, there are some positive signs of economic resilience. First, consumer and business spending remained robust, but this demand was satisfied through imports rather than domestically, while at the same time exports globally contracted. Second, government spending fell 2.7%. The question now will be whether the Fed will use this as an excuse to walk back some of their hawkish talk from May. Or, will they look through the weak headline number and reference the underlying positivity as a reason to continue their tightening program? With equities rising following the news release and yields remaining stubbornly high, it seems bond and stock markets are predicting different outcomes.
April 01, 2022
The Wall of Worry, Is It Different This Time?
First Quarter 2022 Newsletter
Bonds Face Worse Start to Calendar Year – March helped pull U.S. equity indices out of correction territory, defined as a peak-to-trough decline of more than 20%, as risk assets rebounded from a difficult start to the year. The key themes that dominated the market during the first quarter were inflation, rising rates and the conflict between Russia and Ukraine. With U.S. CPI reaching ...
Bonds Face Worse Start to Calendar Year – March helped pull U.S. equity indices out of correction territory, defined as a peak-to-trough decline of more than 20%, as risk assets rebounded from a difficult start to the year. The key themes that dominated the market during the first quarter were inflation, rising rates and the conflict between Russia and Ukraine. With U.S. CPI reaching 7.5% and European inflation touching 5.8%, there is strong pressure for the Fed and ECB to tighten monetary policy, through higher interest rates mainly. While raising rates can keep inflation under control in a growing economy, today’s situation is less certain. Inflation appears to be increasing as a result of excess liquidity, supply chain disruptions and inadequate capital expenditures. Furthermore, the yield curve (interest rates over different time periods) has already flattened, which has in the past been a good predictor of a coming growth slowdown or even a recession.
The Wall of Worry, Is It Different This Time? – There are no shortages of bearish narratives these days in global markets. The central banks raising short-term interest rates to combat inflation, the very sad news of war in Ukraine, continued lockdowns in China and the flattening yield curve makes it difficult to maintain a positive outlook. Sentiment certainly reflects this with the AAII Investor Sentiment Survey showing optimism among individual investors falling to a level not seen in nearly 30 years. Positioning is also beginning to echo sentiment with Large and Small Traders lowering their exposures. This combination has placed the market at an interesting juncture.
With inflation hitting the wallets of consumers around the world, Central Banks use rate increases to combat inflation. In theory, rate increases should slow demand as borrowing costs increase. Thus less discretionary spending occurs. This in turn slows the economy, particularly in the U.S. where consumption makes up the lion’s share of gross domestic product. A bit surprising, is the fact that stocks typically perform reasonable during the rate increase cycle. Over the last 12 rate hike cycles, Truist Advisory Services found the S&P500 posted a total return at an averaged annualized rate of 9.4%, showing positive returns in 11 of those periods.
This cycle naturally has its own nuances, in addition to having just injected the economy with the most capital ever outside of the World Wars, the world now faces the possibility of energy and food shortages due to the war in Ukraine. Higher energy prices played a significant role in the 2008 recession with prices going parabolic. Higher hydrocarbon prices not only impact corporate margins through raw material prices, it also slows demand for travel. But it is not just higher input costs crimping margins, wages are increasing as corporations attempt to lure people back into the job market. Declining margins have historically led to lower valuations.
A zero COVID policy continues to be implemented in China. The difficulty of managing locking down cities with 26 million people has become more evident as there are reports of food shortages and riots. Here in North America, supply chains are facing their largest challenges to date as factories and ports in China are shut down. This is coming at a time of already slowing earnings growth and putting further pressure on margins. The most severe of the impacts will begin to take place during the second quarter and extend for six to 9 months.
The yield curve, which maps the interest rate over different durations, has already inverted. This has a history of occurring just prior to recessions. While equities have indeed been spooked by the flattening, there are structural forces at play in the market causing yields to spike, particularly on the short end. With sentiment recognizing this, we anticipate a number of sharp rallies as volatility will remain high. During the 2000 bear market, there were 16 rallies by the NASDAQ that were greater than 10%, averaging just over 22%.
Therefore, with news flow, economic data and forward indicators pointing to more market downside, our preference remains to seek out quality investments, while remaining nimble to capture sharp rallies.
March 31, 2022
Stocks Dragged From The Boneyard
Market Recap & Boxscore
“Beware the Ides of March” was meant to warn Julius Caesar of his eventual assassination in Shakespeare’s play. However, it was an appropriate warning for short sellers this year. Following an initial 4.6% drawdown to start March, the 15th of the month marked the beginning of an 11-day, 11.3% recovery in the S&P 500 to finish the period up 5.6%. The TSX was positive 4.4%, while th...
“Beware the Ides of March” was meant to warn Julius Caesar of his eventual assassination in Shakespeare’s play. However, it was an appropriate warning for short sellers this year. Following an initial 4.6% drawdown to start March, the 15th of the month marked the beginning of an 11-day, 11.3% recovery in the S&P 500 to finish the period up 5.6%. The TSX was positive 4.4%, while the MSCI World Index rose 4.9%.
In early March, the VIX Index, which measures the stock market’s expectation of volatility, reached levels not hit since October 2020. The short-term outlook was forbidding given the situation in Ukraine, the beginning of the Fed’s hiking cycle and a quarterly options expiry. But, the flashpoint for a rebound often occurs when doubt is deepest. As time passed without a downside surprise, hedges were forced to unwind and a reflexive upward thrust was released, the likes of which we have not seen since the COVID lows.
Commodities extended their march higher, with the Bloomberg Commodities Index rising 9.6%, and 30% year-to-date. The combination of oil’s weight in the index and its 13.3% rise in March helped propel the gauge, but agricultural and metals are significant contributors due to the supply chain disruptions caused by Russia’s assault on Ukraine. The Canadian dollar’s ascent was unbroken, gaining 2.2%. The loonie is restoring its petro-dollar label after being essentially static when oil prices rose from US$65 to over US$100.
Outside of equities, action in the bond market remains volatile as the 10-year yield rose 53bps to 2.38%. The short end of the curve exhibited an even more dramatic move, with the 2-year rising 65bps to 2.35%, briefly flipping the difference between the 10-year and 2-year yield into negative territory. This negative yield curve is seen by many as a harbinger of recession due to its perfect track record since the 1980s, but as we’ve discussed numerous times the outlook was clear regardless of the inverted yield curve. With the nominal yield (2.38%) below the 10-year breakeven inflation (3%), the market was already pricing a growth slowdown over the next decade. With most of the action happening on the short-end, the market is declaring that an aggressive Fed will only accelerate the slowdown.
So, where does that leave us with the S&P 500 off 3.5% year-to-date? First, the bad news. Bonds are revealing that we’re likely to enter a recession in the next year. The Fed is intent on hiking into this downtrend, while commodities are gaining, employment is peaking, economic growth is cresting and the market is nearing all-time highs. However, the market doesn’t always reflect the economy, which was validated as recently as 2020. Opposing the bear view is the fact that economic growth and employment are strong, even if these are topping. Moreover, positioning among levered funds is now fairly tight after a deleveraging to start the year, real rates continue to be negative, indicating a loose environment, and most important, the recovery in risk assets despite a negative environment is indicative of a bull market. Finally, from a supply/demand picture, IPO supply is anticipated to be very low, while buybacks in the U.S. are currently approved at US$319 billion, compared to US$267 billion at the same point last year. Market pundits or news sources are too often pursued for forecasts and predictions, while the market’s ability to effectively price risk is regularly ignored. Currently, there is a wide range of uncertainty priced into the market. Accordingly, we respect the downside scenario, but also recognize that risk can be rewarded to the upside.
March 10, 2022
Ukraine & The Market Downturn
Interim Market Update
Russia’s military invasion of Ukraine is producing a humanitarian crisis and suffering that is drawing comparisons to the Second World War. The attachment below provides a modest perspective on the conflict and some guidance on the investing implications. Overall, it is critical to recall that equity markets delivered positive outcomes over 5-10 year holding periods despite combat in ...
Russia’s military invasion of Ukraine is producing a humanitarian crisis and suffering that is drawing comparisons to the Second World War. The attachment below provides a modest perspective on the conflict and some guidance on the investing implications. Overall, it is critical to recall that equity markets delivered positive outcomes over 5-10 year holding periods despite combat in Iraq, Korea and WWII. As always, we encourage you to reach out with any questions or comments.
February 28, 2022
What Is Up With Inflation?
Smart Money
Well before Russia’s shameful invasion of Ukraine caused oil and natural gas prices to spike, there was plenty of talk surrounding red hot inflation and its impact on consumers. In addition to its affect on the cost of living for individuals, investors are experiencing a variety of challenges when constructing their investment portfolios. Click the link below to learn about infl...
Well before Russia’s shameful invasion of Ukraine caused oil and natural gas prices to spike, there was plenty of talk surrounding red hot inflation and its impact on consumers. In addition to its affect on the cost of living for individuals, investors are experiencing a variety of challenges when constructing their investment portfolios. Click the link below to learn about inflation, how it has recently affected your outflows and how your portfolio should have been positioned.
February 25, 2022
“A Time for Iron Resolve”
Market Recap & Boxscore
Following January’s bout of volatility, February failed to provide any reprieve as markets continued to have difficulty pricing the risk of a more aggressive Fed. This, combined with Russia’s shameful invasion of Ukraine on 24-Feb-22 caused the S&P 500 to fall 3% during the month, marking an 8% decline year-to-date. The MSCI Index fell 2.4%, while the TSX’s exposure to energy and ...
Following January’s bout of volatility, February failed to provide any reprieve as markets continued to have difficulty pricing the risk of a more aggressive Fed. This, combined with Russia’s shameful invasion of Ukraine on 24-Feb-22 caused the S&P 500 to fall 3% during the month, marking an 8% decline year-to-date. The MSCI Index fell 2.4%, while the TSX’s exposure to energy and materials helped it remain flat for the period and just below break-even for the year. The unrest in Eastern Europe arrested the weakness in the U.S. Dollar and U.S. Treasuries, as investors flocked to the traditional safety of the world’s largest and most liquid economy. Nevertheless, the DXY was only flat for the month, and the 10-year yield rose 0.19%, down from 0.28% prior to Moscow’s attack.
Commodities continued to catch a bid in February, no doubt fueled by tensions in Eastern Europe where either Russia or Ukraine are key suppliers of oil, natural gas, wheat and palladium. The implementation of economic sanctions on Russia including the removal of Russia and its major banks from the SWIFT network will inflame an already hot market. Simply put, the SWIFT network allows banks, including Russia’s central bank, to send and receive payments. These actions are designed to limit the flow of exports from Russia and to prevent Vladimir Putin from using $630 billion in central bank currency reserves to fund its war. Accordingly, the decline in Russia’s provisions will further stress the already undersupplied commodity market thereby pushing prices higher. The global consumer is already feeling the effects of a commodity bull market that began in mid-2020. Additional stress on the consumer is a major political risk in an economy that is starting to slowdown. This is a major predicament for global central banks. Tighter conditions are needed to cool demand and soften food and gas prices, but if they overreach, they could be inserting the equivalent of the 1995 New Jersey Devils’ Neutral Zone Trap into the economy. Will inflation surprise to the upside and force the Fed to tighten more aggressively? Or, will the geopolitical situation provide an out for the Fed to delay its hiking cycle?
Commentators, reporters and “experts” are rarely short on reasons for market movements. However, it is foolish to predict the outcome over the next 24 hours or the next week based on a news headline. For instance, the S&P 500 futures market was down 10% (month-to-date) after Putin announced that he ordered a special military operation in eastern Ukraine and missiles struck dozens of cities across the country. Since that low point, the market rallied 7% in two days. Rather than attempt to foretell the following week or month’s events, we can only offer that the confluence of factors will provide an environment of heightened volatility. Therefore, for markets, and more importantly the innocent lives in Ukraine, the absence of peace will create more uncertainty, fear and arbitrary outcomes. Additionally, a more involved NATO/U.S. could also increase the risk of a nuclear threat and the unknown consequences.
Looking forward to the upcoming month, all eyes were originally fixated on the Federal Reserves’ meeting in mid-March. The impact that commodity prices, in particular oil and agricultural products, were having on inflation were primary considerations for the launch of an interest rate tightening cycle. However, the geopolitical and humanitarian events associated with the Kremlin’s senseless aggression, have distracted people’s attention while also compounding the central banks predicament. At this point, and in most aspects of forecasting, we can only be certain of uncertainty.
January 31, 2022
Olympic Hockey Primer
Smart Money
When the NHL and NHLPA decided to abandon the 2022 Olympics, the tournament was drained of its star attractions like Connor McDavid, Auston Matthews, and Alexander Ovechkin. While hockey fans will not get the joy of watching a “best-on-best” clash in Beijing, it will be an exciting competition featuring a mixture of young players and veterans who are inspired to play in a showcase tha...
When the NHL and NHLPA decided to abandon the 2022 Olympics, the tournament was drained of its star attractions like Connor McDavid, Auston Matthews, and Alexander Ovechkin. While hockey fans will not get the joy of watching a “best-on-best” clash in Beijing, it will be an exciting competition featuring a mixture of young players and veterans who are inspired to play in a showcase that was otherwise elusive. Click the link below to see a brief tournament primer for the men and women, including the leagues that are represented, age breakdowns and gold medal betting odds.
January 28, 2022
When The Tide Goes Out
Market Recap & Boxscore
Following an incredible 27% rise in 2021, the S&P 500 started 2022 by heading in the opposite direction. The index fell over 10% in January, but as of 28-Jan-22, it had settled at losses just north of 8%, similar to the global (MSCI World) benchmark. The TSX faired better, sliding just 3%, due to its heavy allocation to sector leaders, Energy and Financials. The major event this m...
Following an incredible 27% rise in 2021, the S&P 500 started 2022 by heading in the opposite direction. The index fell over 10% in January, but as of 28-Jan-22, it had settled at losses just north of 8%, similar to the global (MSCI World) benchmark. The TSX faired better, sliding just 3%, due to its heavy allocation to sector leaders, Energy and Financials.
The major event this month was the U.S. Federal Reserve meeting on 25-Jan-22, where Governor Powell followed up a fairly muted Fed Statement with a very hawkish Q&A session, in which he pointed to a better-than-expected employment situation and above-average inflation as reasons to start hiking rates and tapering QE. The market was positioned for the hawkish tone, as participants were buying volatility protection. However, traders clearly underestimated the risk of an accelerated tightening in a potentially slowing economy.
Oil’s continued strength (+16% month-to-date as of 28-Jan-22) did nothing to temper investor worries around inflation and its influence on the Fed. The stress was evident on the short-end of the U.S. yield curve, as the 2-year yield rose aggressively from 0.73% to 1.18%. This movement implies six rate increases by the end of 2023. Economic growth in the first half of 2022 will surely show a slower pace than the above average levels reported in the first half of 2021. As such, tightening monetary policy into an economy that is losing speed, will hurt equity performance. Accordingly, inflation will be closely monitored for insight into the Fed’s actions.
On the long-end of the yield curve, bonds have not provided the cushion for equity weakness to which investors have become accustomed. The Barclays Aggregate Bond Index fell over 2% as the 10-year yield rose. In general, long-term yields fall when the short-end increases. Long bond rates are typically priced off the combination of growth and inflation. Consequently, tightening monetary conditions are negative for growth rates and inflation rates; thereby, causing long-term yields to fall. As such, it is noteworthy that short-term yields and long-term yields moved upwards together this month. One explanation for rising long-term yields is the sensitive supply-demand outlook for long-term Treasury Bonds. The Fed is scheduled to reduce its monthly purchases of Treasury Bonds and the absence of its bid from the market will put downward pressure on prices, causing yields to rise.
The U.S. dollar, as measured by DXY, rose 1.2% during the period and soared almost 3% from its January low. Naturally, if the market is expecting a more aggressive Fed, especially against a more dovish ECB and Bank of Canada, one would expect the U.S. dollar to rise. However, this hypothesis is not that reliable. Since 1977, the Fed has attempted to increase rates on five separate occasions. On two occasions (1977-1980 and 2015-2018), the dollar ended the cycle at a similar level to where it started. In the remaining three periods, the U.S. dollar sunk between 10% and 15%. Hence, the strength of the U.S. dollar may be closer to its peak; and conceivably, the crowded long positioning in the Greenback is supportive of its cresting popularity.
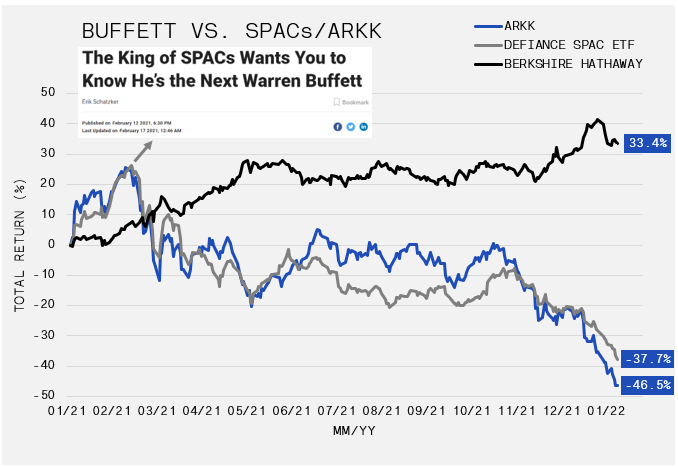
Warren Buffett has a famous quote that reads “only when the tide goes out do you discover who has been swimming naked.” The past twelve months have provided an opportunity to understand its pertinence. Following a terrific year for growth and technology stocks, 2021 started brilliantly as gains compounded with the monumental performance of meme stocks and SPACs. Many were once again questioning Mr. Buffett’s ability to navigate markets in a new tech-driven world, pointing to newly minted leaders like Cathy Wood and Chamath Palihapitiya as the new age. The chart that follows reveals the performance of Berkshire Hathaway (Warren Buffet) versus ARK Innovation ETF (Cathy Wood) and Defiance Next Gen SPAC Derived ETF. No further commentary is necessary.
January 03, 2022
All (Bumpy) Roads Lead to Equities
Fourth Quarter 2021 Newsletter
Stocks Stage Year-end Upswing – Large-capitalization US and Canadian stocks staged a year-end upswing, underpinning a strong quarter, and year, for North American equities. The fourth quarter opened with the passage of the bipartisan Infrastructure and Jobs Act that sent risk assets higher. The momentum stalled, albeit temporarily, in late November by fears surrounding Omicron (COVID-...
Stocks Stage Year-end Upswing – Large-capitalization US and Canadian stocks staged a year-end upswing, underpinning a strong quarter, and year, for North American equities. The fourth quarter opened with the passage of the bipartisan Infrastructure and Jobs Act that sent risk assets higher. The momentum stalled, albeit temporarily, in late November by fears surrounding Omicron (COVID-19 variant). At the same time, inflation prints crossed 6% for the first time since 1990 forcing the Federal Reserve to walk back its use of “transitory inflation”. Eventually, most markets climbed the “Wall of Worry”. The most significant deviation came from China which suffered from stringent COVID policies that exacerbated an economic slowdown.
Bonds finished the quarter flat. However, most sovereign debt instruments had losses in 2021 as yields moved higher. Yield curves flattened, with short-dated bonds hit as central banks turned more hawkish. The US 2-year yield increased from 0.28% to 0.73% during the fourth quarter.
All (Bumpy) Roads Lead to Equities – Financial journalists often glorify markets, emphasizing the extreme moves over long timeframes as though it was an effortless journey. Often lost in stargazing at historical charts is that it is seldom a straight line, there are many head-fakes in either direction and markets often consolidate – neither continuing the existing trend nor veering along a new path. Our expectation for 2022 is for volatility to highlight the difficult path in staying the course, testing investor patience often.
The pace of growth for the world economy appears to be slowing despite a few tailwinds. The bond market is picking up on this, with the yield curve flattening along with slowing ISM readings, job creation and other economic indicators. Lapping difficult year-over-year comparisons in the first half the year, it is likely to lead to a challenging backdrop for equities.
The handling of the COVID crisis has resulted in rising dissatisfaction with political leaders. Citizens in an increasing number of countries are pushing back on restrictions and rejecting leadership by (or for) the elite class. It is unlikely coincidental that this is occurring with inflation readings at multi-decade highs, December CPI was 7%. Inflation is often the tipping point (see Tiananmen Square and The Arab Spring) for uprisings.
Structural headwinds have not gone away for most major economies. Unfavorable demographics, excessive debt and regulation have crimped growth for much of the recovery since 2009 and these issues remain. The US Federal Reserve certainly is not oblivious to this fact and has attempted to “let the economy run hot”. However, the market now appears to be pushing back, pricing in four rate hikes and lifting commodity prices further despite economic indicators rolling over. A moderation in commodity prices would suggest the December CPI was the top for this cycle. However, this has not occurred. Moreover, net long positions in the US dollar imply that meaningfully more support for the greenback is not on the horizon. A stronger US dollar would slow commodity prices.
With this as the backdrop coming into 2022, We have become more constructive on quality and interest rate sensitive investments. To make room, commodity positions have been reduced along with small capitalization names. Gold remains a healthy position and should perform well with declining nominal yields, unstable equity prices or geopolitical unrest (Russia/Ukraine or China/Taiwan).
Four Federal Reserve rate hikes are currently priced-in to the markets. However, the tightening cycle could intensify the economic slowdown and impair equity performance. This would likely force the Fed to depart from their plan. The contrary view is that the cycle will remain in force as COVID restrictions and supply chain bottlenecks diminish. As we get deeper into 2022, year over year economic comparisons ease. With growth stocks feeling the brunt of the recent sell-off, our focus will turn to quality names within this style group.
December 23, 2021
The NFT Mania
Smart Money
A new type of digital asset exploded in popularity in 2021 – NFTs or “non-fungible tokens”. Examples of NFTs range from digital artwork and sports cards to pieces of land in virtual environments. Enthusiasts and investors have allegedly spent $22 billion in this rapidly expanding market. Check out our video summarizing the new asset and its developing role in the sports world.
December 22, 2021
Choppy Markets Scramble to the Finish Line
Market Recap & Boxscore
As of 22-Dec-21, equity markets delivered positive returns during the final month of 2021. The US benchmark (S&P500) was positive 2.84%, the S&P/TSX and MSCI World Index followed with gains in the 2% range. The upbeat results concealed significant volatility that arose through three primary sources; (i) the Fed met on 14-Dec-21 and announced an accelerated taper of bond purcha...
As of 22-Dec-21, equity markets delivered positive returns during the final month of 2021. The US benchmark (S&P500) was positive 2.84%, the S&P/TSX and MSCI World Index followed with gains in the 2% range. The upbeat results concealed significant volatility that arose through three primary sources; (i) the Fed met on 14-Dec-21 and announced an accelerated taper of bond purchases while also expanding the forecast for interest rate increases from two to three in 2022; (ii) the expiry of both options and futures positions on Friday (17-Dec-21); and, (iii) the aggressive spread of the current Omicron variant, which re-introduced numerous shutdowns and travel restrictions globally.
Often key events like (i) and (ii), especially when occurring simultaneously, will cause widespread market participants to hedge possible declines. This in turn has the potential to cause a positive feedback loop because dealers typically adjust their offsetting positions by selling the underlying asset after its price falls. The combination of these events along with renewed COVID-19 fears caused the S&P500 to lose over 3% during the six trading days between 13-Dec-21 and 20-Dec-21. However, when the event for which protection was sought is determined to be less treacherous, the subsequent covering of the original hedges often pushes prices upwards. Consequently, the 3% loss was essentially erased by the profits registered on the 21st and 22nd.
The yield curve flattened leading up to the Christmas break. Following the Fed’s announcement that an additional interest hike should be anticipated in 2022, the 2-year yield remained slightly below the peak (0.69%) touched in early December. This is an indication that the aggressive increase in yield since June (from below 0.15%) may have tired. Concurrently, the 10-year yield has settled at about 1.45%, quite a distance from the 1.67% print in late November. The 10-year continues to trade toward the lower end of its up-trend since August. If a breakdown occurs in the first quarter of 2022, this will potentially indicate that the market has lost confidence in the prospects for economic growth or possibly that inflation fears have been extinguished.
On the commodity front, gold caught a bid as nominal yields fell, rising 1.87% in December. Nevertheless, the price remains in the middle of its 2021 trading range. If long yields break down and growth slows into 2022, the shiny metal may have the flight for which so many have hoped. Oil reversed its November weakness, with WTI increasing 2.2% in December, though it remains 13% off its October highs. Finally, the USD, as measured by the DXY, was flat during the month, though it did rise 0.8% against CAD.
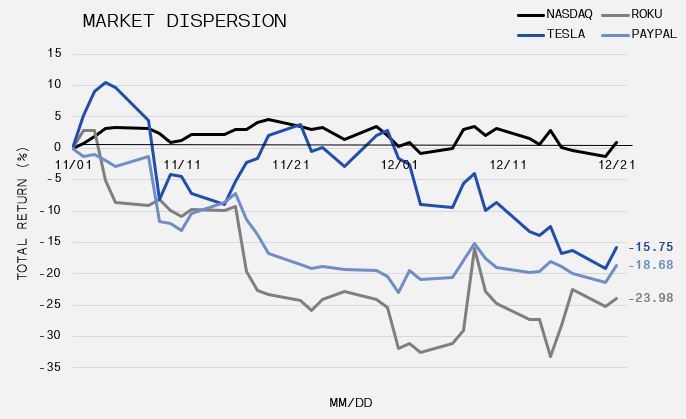
The TSX’s underperformance relative to the S&P500 since mid-November speaks to many factors playing into markets globally. The TSX is about 3% below its high point for the year reached on 12-Nov-21, while the S&P has gained about 1% during the same period. However, each benchmark’s composition provides insight into the return dispersion. The TSX’s top holdings are represented by Shopify, Canadian National Railways, Enbridge and the large banks. Meanwhile, The S&P largest weights are all technology-focused giants; Apple, Microsoft, Amazon, Alphabet (Google), Nvidia and Meta Platforms (Facebook). The performance of these behemoths conceals the struggles of the stocks beneath the largest weights. The accompanying chart discloses this phenomenon by demonstrating how the NASDAQ appears resilient while other prominent names have been battered since 01-Nov-21. Similarly, on 07-Dec-21, Gavin Baker revealed on Twitter that NASDAQ’s mighty 21.2% gain for the year was reduced to only 5.8%, when Apple, Microsoft, Alphabet, Tesla and Nvidia, were excluded. Large cap dominance has been a common narrative since 2019, but as we gaze into 2022, the persistence of the trend will be closely examined. A horse can’t run with a wounded leg.
November 30, 2021
A Savvy Approach to Charitable Giving
Smart Money
Among professional athletes, hockey players are often viewed as philanthropic leaders. Take for instance the league-wide involvement in this past month’s Hockey Fights Cancer campaign, or the unrivaled participation in the always popular Movember competition. As the holiday season approaches, hockey players, like many others are reminded of their fortunate situations and the importanc...
Among professional athletes, hockey players are often viewed as philanthropic leaders. Take for instance the league-wide involvement in this past month’s Hockey Fights Cancer campaign, or the unrivaled participation in the always popular Movember competition. As the holiday season approaches, hockey players, like many others are reminded of their fortunate situations and the importance of supporting those less fortunate. Click the link below to learn more about the substantial and lasting impact you can have with the increasingly popular “Donor Advised Fund”.
November 29, 2021
Investors Reposition Assets To Hide From Omicron
Market Recap & Boxscore
Third quarter earning reports lifted equities early in the month until a violent selloff after Thanksgiving Day. For the period ending on 28-Nov-21, the S&P 500 gained 0.9%, while the TSX grinded out a small 0.3% gain as Energy took a breather. The MSCI World Index was the laggard, dropping 1.1% as European weakness led the drawdown. Germany’s DAX Index fell 2.5%. Certainly, the s...
Third quarter earning reports lifted equities early in the month until a violent selloff after Thanksgiving Day. For the period ending on 28-Nov-21, the S&P 500 gained 0.9%, while the TSX grinded out a small 0.3% gain as Energy took a breather. The MSCI World Index was the laggard, dropping 1.1% as European weakness led the drawdown. Germany’s DAX Index fell 2.5%. Certainly, the situation with COVID-19 in Europe is much worse than North America. Many countries are recording case counts that far exceed the third wave data. Moreover, Austria and the Netherlands are entering another stage of restrictions and lockdowns.
U.S. stock benchmarks are often dominated by a relatively small number of companies or large cap tech leaders. The top ten positions in the S&P500 represent more than 30% of the capitalization. Predictably, when we look under the hood, we observe that there was limited participation in the uptrend that preceded Thanksgiving Day. Fewer and fewer US companies were trading above their 50-day moving average, which is typically a sign of market fragility. Similar to equities, high yield bonds faltered as month-end approached. The U.S. High Yield Options Adjusted Spread rose from 3.15% to 3.62%. The concentration of Energy issues within the High Yield universe had an outsized impact, but the 3.62% yield is the highest level since March 2021. Access to capital and liquidity have a considerable influence on markets and the economy. The inability to raise money or if the cost to borrow becomes too expensive, businesses become less profitable and unable to expand their workforce, grow their product lines or invest in new opportunities. The current reading is in line with its long-term averages, so it is by no means a sign of long-term market stress – but the trend needs to be monitored.
The Friday after U.S. Thanksgiving is typically reserved for nursing hangovers and analyzing another Detroit Lions loss, but 2021 was different. While US investors still woke up to another Lions loss, there was also a sea of red across equity indices, commodities, and crypto. The Russell 2000 (small-cap stock market index) led the way down, losing 3.7%, while S&P 500 and Nasdaq fell 2.3% and 2.1%, respectively. News of a new COVID-19 variant, Omicron, triggered demand for large cap and tech-heavy indexes, while the reflation/re-opening sectors were shunned. Governments quickly enacted travel bans and momentum for additional lockdowns advanced across Europe and into North America, which caused oil to be the day’s biggest loser, down 12.0%. US Bond performance was equally volatile, with the long-end serving as a flight to safety as the 10-year yield ended the day down from 1.636% to 1.482%. While this was one of the largest one-day moves in recent times, the action at the short-end was even more material as the 2-year yield fell from 0.644% to 0.508%. Yields on the short-end have been increasing aggressively since June as the market anticipated an accelerated pace of Fed tapering and interest hikes. The threat of COVID-induced slowdown obviously tempered these expectations.
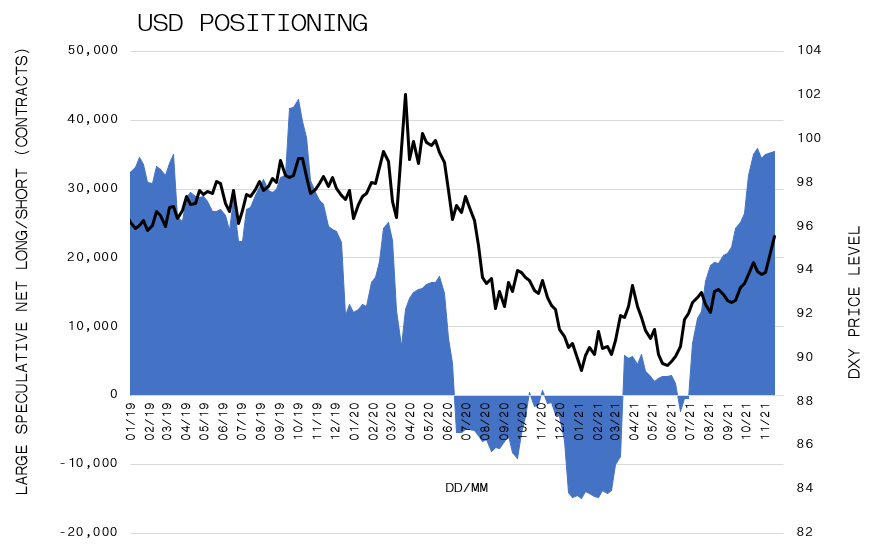
Investor money flows and positioning shifted post-Thanksgiving, particularly in over-crowded areas like the Russell 2000, 10-Year U.S. Treasury Bond and the U.S. Dollar. Russell 2000 had recently become net long as speculators piled into the benchmark. Consequently, risk-takers quickly became sellers as the Omicron news circulated. Similarly, the 10-Year Bond was a popular position for short-sellers wishing to take advantage of the outlook for rising rates. These positions were quickly covered when growth prospects diminished. Most interestingly was the behaviour of the U.S Dollar. The greenback has been propelled higher by large speculator interest. The long position has not been this crowded since November 2019. Typically, when markets falter, investors engage in a flight to safety which causes the U.S. dollar to rise on risk-off days. However, the DXY (the index of the U.S. dollar relative to a basket of foreign currencies) fell 0.7%, a relatively large move down.
Looking out over the very short-term, governments’ response to the new variant and the scientific communities’ reaction to the mutation will likely dictate if investors exercise more traditional re-balancing into year-end or if the Thanksgiving selloff was the onset of a more meaningful correction.
October 31, 2021
The Big Four: Bigger, Stronger, Wealthier (?)
Smart Money
The total value of the global sports market is estimated to be greater than $600-billion, making it among the most lucrative entertainment industries in the world. Specifically, North America’s professional sports revolve around its four major leagues; the NFL, NBA, MLB, and NHL. As each league looks to rebound after an impactful pandemic, GAVIN has reviewed their revenue, growth and ...
The total value of the global sports market is estimated to be greater than $600-billion, making it among the most lucrative entertainment industries in the world. Specifically, North America’s professional sports revolve around its four major leagues; the NFL, NBA, MLB, and NHL. As each league looks to rebound after an impactful pandemic, GAVIN has reviewed their revenue, growth and value, in addition to future plans to aid their recoveries.
October 28, 2021
The company formerly known as Facebook falters while markets rally
Market Recap & Boxscore
Markets re-established their 2021 uptrend in October, led by the S&P 500 Index, rising 5.2%, as of 27-Oct-21, as it hit a new all-time high. The TSX Index was not far behind, as strength in energy and financials contributed to a 5.1% gain for the month. The MSCI World Index lagged but still managed to pop 4.6% during the month. Commodities continued to march higher, with the CRB C...
Markets re-established their 2021 uptrend in October, led by the S&P 500 Index, rising 5.2%, as of 27-Oct-21, as it hit a new all-time high. The TSX Index was not far behind, as strength in energy and financials contributed to a 5.1% gain for the month. The MSCI World Index lagged but still managed to pop 4.6% during the month. Commodities continued to march higher, with the CRB Commodities Index climbing 4.0%. WTI Oil surged 11.2% and breached $85 for its first time since 2014. Rates initially appeared to extend its uptrend, with the 10-year U.S. Treasury yield rising from 1.52% to 1.70%, but a late rally in bonds helped bring the long-end back down to even. This event similarly reversed some of the small cap outperformance over technology that started the month. Gold rose 3.4% and continues to be range-bound.
It was interesting to observe the aggressive moves in stock benchmarks without corresponding strength in the FAANG names. The only name to outperform the S&P amongst the five was Netflix, posting a 12.7% gain in October on strong earnings and subscriber growth which beat analyst expectations. (Thank you, Squid Game!). The biggest laggard of the group continues to be Facebook, down 10.9% in October and 14.8% over the last three months. There has been no shortage of narratives to justify the fall, and likely much of this started back in April when Apple announced iPhone privacy changes that would prevent advertisers from tracking iPhone users without their consent. It is no secret that FB’s bread and butter has been their ability to track and personalize advertisements, and without the ability to do so, the appeal of FB for marketing spend has subsided. Their third quarter results showed the company missed expectations on advertising performance. Further, FB announced a massive capital spending program to fund growth initiatives like AR/VR and their foray into the metaverse, which starts to introduce some thesis creep into the bull case. It is worth noting that supply chain issues are also potentially affecting the company’s results. There is less incentives for product vendors to spend on advertising without goods to sell. In any case, doubts about FB’s growth forecasts are certainly emerging.
The third quarter earning season has begun and the market’s reaction to the reported results has been noteworthy. A selloff in the reporting company’s stock price has largely been the outcome even for those who beat expectations. While the bull trend remains intact, we will be monitoring a couple of factors to gauge the rally’s vigour; (1) the relative strength of large cap tech, and (2) if price momentum fades despite top and bottom-line results that substantially beat expectations.
Rates and inflation remain top of mind for investors. Globally, long-term yields have risen and breakeven inflation rates have moved to levels not seen since we exited the Global Financial Crisis. Accordingly, the U.S. Federal Reserve’s actions will garner massive attention. Decision makers greeted early signs of inflation from November 2020 through to mid-2021 with confidence that price increases were transient. However, more recently, commentary suggests that secular inflation fears are mounting. Meanwhile, the Bank of Canada cited “higher energy prices and pandemic-related supply bottlenecks now appear stronger and more persistent than expected.” As a result, they declared their intention to start lifting rates quicker than anticipated. The Bank is also ending its QE program which originally purchased C$5 billion of government bonds per week. The challenge for policy makers and investors is to process the sustainability of better-than-expected growth with higher-than-expected prices.
October 15, 2021
Real Estate as an Asset Class
Third Quarter 2021 Newsletter
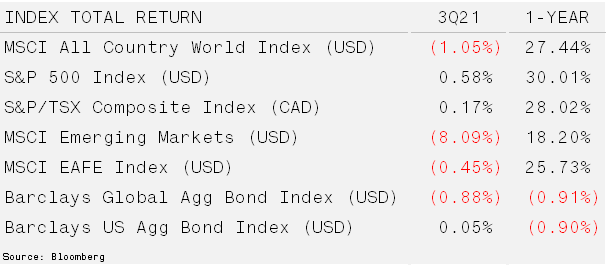
September Effect Hits Equities – North American equities were mixed for the third quarter, giving back most of their gains in September. The S&P 500 was the leader for the quarter with emerging markets struggling mightily as China slowed and global COVID case counts increased. The often-discussed September Effect caught up with equities. Since 1929 the S&P 500 has lost 1.0% on...
September Effect Hits Equities – North American equities were mixed for the third quarter, giving back most of their gains in September. The S&P 500 was the leader for the quarter with emerging markets struggling mightily as China slowed and global COVID case counts increased. The often-discussed September Effect caught up with equities. Since 1929 the S&P 500 has lost 1.0% on average during September versus a +0.8% for all the other months.
Bonds also gave investors something to worry about as equity market weakness coincided with bond price declines. After falling to a closing low of 1.17% in August, the US 10-year Treasury yield finished the quarter at 1.49%. Despite a rising US dollar, crude prices made their way back to cycle highs also by quarter end. Rising yields and commodity prices are following inflation numbers higher which is happening across the globe.
Investment Opportunities Within Real Estate – The global real estate market can be classified into two broad categories: residential, where lots or dwelling units are owned, and commercial, which are income generating assets. Commercial real estate includes offices, industrial, healthcare, retail centers, hotels and multifamily rental apartment properties. Other forms of real estate-related investments are real estate-intensive operating companies, real estate investment trusts, loan pools and real estate debt. Investors exploring opportunities in the asset class have many options that offer a range of benefits and risk-return profiles.
Some of the benefits of investing in real estate include attractive total returns, portfolio diversification, inflation hedges and downside protection. The necessity function of real estate creates consistent cash flows that often lead to strong returns. According to the NCREIF Property Index, returns for real estate over the last 15 years were 6.85% annually versus 10.5% for the S&P 500. While these figures may surprise investors, the diversification and inflation benefit of real estate investing make it an attractive asset class for all types of investors.
Real estate, specifically private real estate, has historically displayed low correlation relative to stocks and bonds. Furthermore, as a real asset, property markets typically rise in inflationary periods. This is particularly true for short-term lease contracts as rent resets can be negotiated more often. Public storage is an example of a short-duration lease because rental contracts are typically monthly.
While fiduciaries and institutional investors are aware of the diversification and inflation protection benefits of real estate, most investors are attracted to the return potential. As previously illustrated, the returns are misleading, which is due to the use of leverage. As a large, mostly stable asset, lending is required and accepted widely. Therefore, when appreciation occurs, the benefits to equity can be significant. For example, if a $1,000,000 home appreciates at the average NCREIF Property Index rate of 6.85%, it’s leveraged return jumps to 11.42% if it carries a reasonable 40% mortgage.
Avenues to invest in real estate include both debt and equity (ownership) opportunities across private and public markets. The most common equity investment option, also the most liquid, is the real estate investment trusts (REITs). These are often diversified, well-capitalized properties that generate cash flow that is passed on to investors. The downside of this option is the high correlation to traditional equities. On the other side of the liquidity and correlation spectrum is direct investments. The challenge with this strategy is that it requires on-the-ground personnel in target markets and in-depth knowledge of regulations, deal flow and access to capital. A good middle ground that investors are often unaware of is through private real estate investment funds. This strategy can provide slightly more liquidity than direct holdings and it requires far less expertise of the asset. To ensure professional assessments and/or opportunities are maintained a portion of the return is foregone as a service.
Real estate investing has produced solid returns for investors as interest rates have fallen for nearly 30 years. This remains the number one driver for the asset class as a whole. Returns however should be viewed through an unlevered lens (take away leverage) and for most investors, retaining experts to assess the merits of local markets is a good risk mitigation strategy to protect capital. Our partners remain steadfast and operate in growing, diverse economies for our commercial investments while diversification is enhanced through our farmland allocation.
September 30, 2021
NHL Pre-Season Primer 2021-22
Smart Money
To ensure a player is financially prepared for the upcoming season, GAVIN updated its annual Pre-Season Primer. The exhibit provides current and relevant financial data for the upcoming season; including pay periods, escrow rates, income tax rates, NHL group benefits and retirement contributions. Check it by clicking the link below!
September 30, 2021
Stocks Slide in September as Supply Shortages Boost Oil & Gas
Market Recap & Boxscore
Stock markets were able to maintain their footing in August despite being temporarily shaken by volatility. However, September was a different story. The S&P 500 recorded its first negative month of 2021, dipping 4.76%. Canada faired better with oil and financials showing some strength, limiting the TSX decline to 2.5%. The MSCI World Index registered losses that mirrored the U...
Stock markets were able to maintain their footing in August despite being temporarily shaken by volatility. However, September was a different story. The S&P 500 recorded its first negative month of 2021, dipping 4.76%. Canada faired better with oil and financials showing some strength, limiting the TSX decline to 2.5%. The MSCI World Index registered losses that mirrored the US benchmark.
While equities were weak, commodities seemed to have re-ignited as the Bloomberg Commodity Index rose 3.6%. The energy complex paced gains with natural gas up 26.6% in September (up 105% YTD), and WTI crude oil posted a 9.8% jump, bringing its year-to-date vault to 44.3%. While US natural gas price gains have been impressive, the soaring prices across the pond are truly unprecedented. Dutch and UK natural gas prices reached an all time high on 27-Sep-21. Environmental regulations implemented years ago have severely impacted supply, the mandated switch from coal to natural gas has further stressed the situation and governments have not adequately adapted for the intermittency of renewable energy. Further, local supply constraints have been compounded by Russia curtailing distributions to Europe, while demand has also increased 7.6% in the first quarter of 2021. China has experienced similar energy dynamics. The combination of increased prices of coal and natural gas and capped carbon emissions have forced regulators to implement rolling brownouts across the country. At this point, many will hope to avoid a cold winter as any fundamental boost to demand can not be met in the current supply environment.
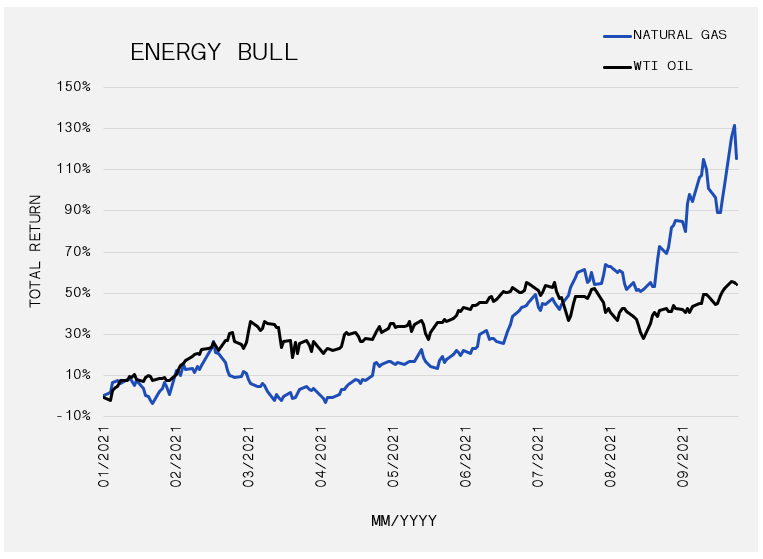
Outside of energy, grains bounced from its post-April lows, and even lumber, the star of the early 2021 commodity rally, woke up with a 23% leap in September. Counterintuitively, these gains were made while the U.S. Dollar (USD) broke above its 2021 high to advance 2.1%. Since commodities are generally priced in USD, they typically move in opposite directions.
Notably, in a risk-off backdrop, it is typical for the USD to rise when stocks fall. Commodities will also sink in this scenario. As such, the strength in the resource sector was uncharacteristic and it is potentially explained by Fed Reserve Chairman Powell’s comments about inflation and the timing of tapering. Tapering is the reduction in central bank asset purchases and it is positive for the US dollar and negative for equities. Meanwhile, the omission of “transitory” from the Federal Reserves meeting minutes, supports higher commodity prices.
Bond yields broke out to the upside in September. The U.S. Treasury 10 and 30-year yields rose 0.22% and 0.13%, to 1.50% and 2.05%, respectively. Some have tried to justify the rise in rates to the U.S. debt ceiling, which if triggered, would potentially lead to a default on their debt. Treasury Secretary Janet Yellen has told lawmakers the U.S. will not have money to pay its bills by about 18-Oct-21. However, if we zoom out, we see similar yield increases across Europe and even into Asia. If the US yield increase has anything to do with default, then likely this would be a more isolated event and not global in nature. Concurrently, equity leadership has shifted to businesses associated with the re-opening themes; such as Booking Holdings Inc., energy stocks, consumer discretionary companies and financial names. Perhaps these occurrences hint at a more robust economy as 2021 winds down and delta COVID case counts subside. Despite the September equity pessimism, in the absence of a surprise taper and/or Fed rate increase, we are not exceptionally concerned about sustained weakness in stocks to end the year.
September 02, 2021
Free Agent Frenzy?
Smart Money
With the expectation that the NHL’s salary cap will stagnate for the foreseeable future, players are adjusting to an uncertain free agent environment and management teams are assembling their rosters with a more resourceful and creative approach. To better understand how these developments are impacting the contracts offered to free agents, GAVIN examined the signings of all UFA and R...
With the expectation that the NHL’s salary cap will stagnate for the foreseeable future, players are adjusting to an uncertain free agent environment and management teams are assembling their rosters with a more resourceful and creative approach. To better understand how these developments are impacting the contracts offered to free agents, GAVIN examined the signings of all UFA and RFAs between 28-Jul-21 and 21-Aug-21.
September 01, 2021
Equity Markets Manage to Stay On Track
Market Recap & Boxscore
The S&P 500 rose 2.4% in August 2021. MSCI World and TSX also registered positive results, gaining 1.8% and 1.6%, respectively. Large capitalization companies have been carrying most of the weight over the past few months. As such, the strength in small and mid-cap names late in the month was noteworthy. In similar fashion, we are starting to see some life re-emerge in the “reflat...
The S&P 500 rose 2.4% in August 2021. MSCI World and TSX also registered positive results, gaining 1.8% and 1.6%, respectively. Large capitalization companies have been carrying most of the weight over the past few months. As such, the strength in small and mid-cap names late in the month was noteworthy. In similar fashion, we are starting to see some life re-emerge in the “reflation trade”. The Financials, Industrials, Energy and Materials sectors outperformed, resuming the trend that occurred from November to June.
Delta variant waves in India and U.K. receded during the month, while daily infections in the U.S. exceeded 280,000. Notably, it had been more than six months since the U.S. had topped 100,000 infections in a single day. Moreover, in June the daily number had dropped to approximately 4,000. The U.K.’s dramatic declining case count provides hope that the U.S. will recover quickly but vaccine hesitancy, aversion to mask wearing and reluctance to self-isolate are seen as risks. As such, the persistence of the reflation trade may well depend on the America’s resolve against Delta, as well as a revival in China’s economy, which may need a jab of policy support to boost growth.
While the month-over month trend continues to push to the upside, we continue to see similar and repeated bouts of volatility in and around the third week of the month corresponding to options expiration (“Opex”). In August, the S&P 500 softened by 2.5% in just three days between the 17th and 19th, before rallying 3.4% to end the month. The move was more pronounced in the Russell 2000, dropping 5.7% before rallying 7.5% to end the month. The narratives used to justify each and every daily move are plentiful. However, the timing of these intramonth drawdowns is getting oddly similar.
In our opinion Opex is a possible explanation because of the option hedging strategies employed by dealers and large banks). When an option buyer enters a position, a dealer who sold the option will buy the stock in the market to remove the risk. When the scale of this activity is high in an up-trending market, gains are compounded as buyer increasingly push up the prices. As the option expiry date approaches, the dealers start to exit the market as the need to hedge subsides, removing that bid from the market that was previously pinned to a certain level. Post-expiration, the opposite occurs as the need to hedge rises again. However, this is not a one-way street, and can work in the opposite direction as put options, which pay as a stock price falls, rise in value as the market falls, which forces additional selling to hedge dealer positioning for puts sold. While the trend remains up which has made every dip a buyable event so far in 2021, the timing and regularity of these events suggests some participants have caught on to the trade and may be looking to front-run the move.
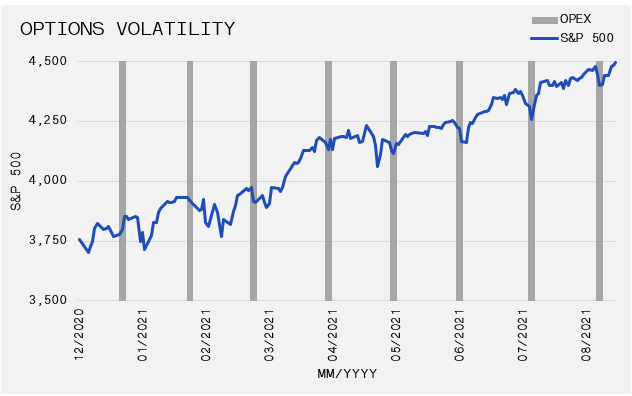
Long rates seemed to have found a short-term bottom in early August. The yield on the 10-year U.S. Treasury bond has climbed 11bps from its post-February low to 1.305%. The U.S. Federal Reserve met in the final week of August to discuss monetary policy. Most speculation going into Chair Powell’s speech revolved around the potential for hawkish statements related to tapering the $120Bn in monthly bond purchases. However, Powell’s speech seemed much more accommodative. Despite the expectation that tapering will begin in late 2021, it does not appear that the Fed is in a rush to disrupt markets by overreaching. Accordingly, we are not overly concerned with higher bond yields in the near term for a couple of reasons (1) the U.S. government is using the surplus in the Treasury General Account to fund its payment obligations, thereby reducing the supply of Treasury Bonds (2) Foreign buyers haves been acquiring Treasury bonds at record high levels amid a search for yields as inflation fears peaked and the global economy paused.
Commodities were mixed in August, although the more cyclical commodities like oil and copper garnered positive momentum in the back half of the month. Oil salvaged what would have been a very weak August, bouncing 10.6% off its 23-Aug-21 low to finish the month down 7%. Soft commodities were mixed while gold finished the month down 0.8%. During the first weekend of the month, gold buckled by over 6.1% with rumours swirling of a forced liquidation from a large player. Gold has been trading sideways for much of 2021 despite falling real rates.
August 05, 2021
Investing in Real Estate
Smart Money
When you think about real estate investing, the first thing that probably comes to mind is a physical property and/or a family home. In fact, home ownership is most often a person’s largest investment. However, there are many opportunities in the real estate market for investors to gain exposure to the numerous benefits of the asset class. Here’s a look at some of the lead...
When you think about real estate investing, the first thing that probably comes to mind is a physical property and/or a family home. In fact, home ownership is most often a person’s largest investment. However, there are many opportunities in the real estate market for investors to gain exposure to the numerous benefits of the asset class. Here’s a look at some of the leading options for individual investors outside of their principal residence.
August 01, 2021
Global Stocks Gain Despite Chinese Tech Crash
Market Recap & Boxscore
The S&P 500 recorded its sixth consecutive monthly advance in July, rising 2.4%. The successive gains represent the longest bull streak in 10 years. The MSCI World followed with a 1.8% improvement, while the TSX lagged with a 0.8% increase as energy and financials were weak. While the large cap averages continued their winning streak, there was a notable divergence with US small c...
The S&P 500 recorded its sixth consecutive monthly advance in July, rising 2.4%. The successive gains represent the longest bull streak in 10 years. The MSCI World followed with a 1.8% improvement, while the TSX lagged with a 0.8% increase as energy and financials were weak. While the large cap averages continued their winning streak, there was a notable divergence with US small caps. The Russell 2000 index dropped 3.6%. Investors seem to be flocking to quality, which bid-up the likes of Alphabet (+7.3%), Apple (+6.5%) and Microsoft (+5.2%) at the expense of smaller and more cyclical companies that led for much of 2021. In addition to the tech giants, yield sensitive sectors like real estate (+4.6%) and utilities (+4.3%) had an impressive July. These segments derive much of their worth from either terminal value discounts or a relative yield advantage. Accordingly, their market price has a strong inverse correlation to bond yields, which was beneficial as the 30-year US Treasury yield slid from 2% to 1.89%.
Decreasing bond yields, the weaker tone in small caps and the big tech outperformance seem to be pointing to lower growth in the back half of the year. This is somewhat anticipated given businesses are approaching the point where year-over-year comparisons will start to get tougher. However, we should also highlight that the yield compression is being underpinned by the semi-regular US fiscal ceiling song and dance, which has limited Treasury supply. Further, the Federal Reserve is continuing to buy $80Bn worth of Treasury Bonds and the $1.6Tr drawdown in the Treasury General Account are influencing yields lower.
Despite the slower growth outlook, the CRB Commodity Index increased 2.3% during the month. Natural Gas was the front runner, with a 5.2% surge. Copper reversed its decline since early May and climbed 4.2%. Agricultural commodities stabilized in July, halting the May-June setbacks. The combination of lower long-term yields and higher commodities indicate the market is sniffing out a low growth, high inflation scenario in the final two quarters of 2021. The economic term for this is stagflation, which is typically undesirable because growth is unable to compensate for the higher cost of living. Sustained softness in small caps will support the stagflation scenario and suggest that additional portfolio protection may be appropriate. For example, gold will be attractive in this environment, as its inflation protection attributes are effective during a stagflation setting, which is characterized by flat to falling yields. Correspondingly, gold prices were +2.4% in July as real yields hit all-time lows.
While the action above was certainly interesting, the real fireworks in July were going off in China, as a large-scale regulatory crackdown on technology continues to rage. Chinese tech shares fell 27.7%, as measured by Kraneshares CSI China ETF (KWEB). The price level is 50.3% below its high reached in February. However, the origins of the crackdown began in November 2020, when the highly anticipated IPO from Ant Financial was killed. Ant founder, Jack Ma, who was the former CEO of Alibaba, criticized financial regulators, and the authorities responded by pulling the plug on the initial public offering. Since then, there have been numerous regulatory actions against companies such as Tencent, Didi and Pinduoduo.
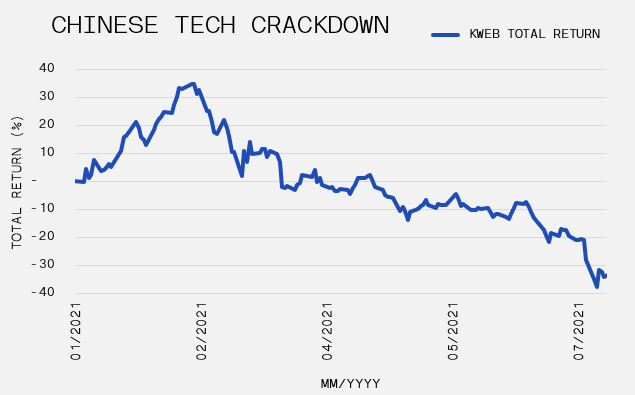
Anti-trust laws that were drafted in 2008 are being enforced by regulators during an unprecedented rise in government scrutiny on monopolistic practices in the tech sector. Furthermore, the Chinese government has taken measures to protect the data that firms collect from its citizens. These events resulted in the regime initiating a cybersecurity review of Didi and suspending the ride-sharing app just two days after its US IPO raised $4 billion. Ultimately, the ruling Chinese Communist Party is attempting to harness private enterprise to safeguard the public from increasing inequality and the potential harm caused by gaming, gambling and ideology that is inconsistent with the central government. The country’s $70 billion tutoring industry was a casualty of the intervention. The State Council banned tutoring firms from making a profit – a convincing message that education cannot be dictated by capitalist pursuits. Chinese tech giants, including Alibaba, Tencent and ByteDance, all recently invested in the education sector. Certainly markets are pricing a less tech-friendly regulatory environment in China, but the global impact has yet to be seen.
July 23, 2021
GAVIN teams-up with Focus Financial Partners
Special Announcement
Focus Financial Partners Inc. (NASDAQ:FOCS) (“Focus”), a leading partnership of independent, fiduciary wealth management firms, announced today that it has entered into a definitive agreement under which GAVIN Hockey Wealth Specialists (“GAVIN”), a registered portfolio manager and investment adviser based in Toronto, will join Connectus Wealth Advisers (“...
Focus Financial Partners Inc. (NASDAQ:FOCS) (“Focus”), a leading partnership of independent, fiduciary wealth management firms, announced today that it has entered into a definitive agreement under which GAVIN Hockey Wealth Specialists (“GAVIN”), a registered portfolio manager and investment adviser based in Toronto, will join Connectus Wealth Advisers (“Connectus”). This transaction is expected to close in the third quarter of 2021, subject to customary closing conditions.
July 15, 2021
Uncertainty Mounts After Another Strong Quarter
Second Quarter 2021 Newsletter
Reopening and Liquidity Underpin Gains – The reopening of the economy during the second quarter underpinned gains across most asset classes. Adding to the economic tailwind, corporate earnings were generally up as sales accelerated and global liquidity surged. More than $1.5 trillion of incremental liquidity was injected into the financial system through central bank quantitative easi...
Reopening and Liquidity Underpin Gains – The reopening of the economy during the second quarter underpinned gains across most asset classes. Adding to the economic tailwind, corporate earnings were generally up as sales accelerated and global liquidity surged. More than $1.5 trillion of incremental liquidity was injected into the financial system through central bank quantitative easing and the US Treasury’s general account drawdown. Large capitalization US growth stocks, including technology and communication services sectors led the gainers.
Interest rates in North America ticked down during the second quarter. Inflation expectations moderated but remain high. However, real yields declined, which helped gold recapture part of its first quarter decline.
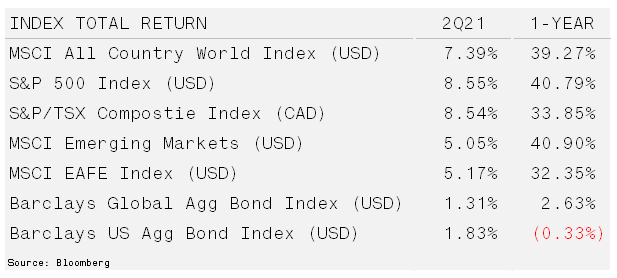
Multi-Factor Approach to Sports and Investing – As we approach the 2021 NHL draft, general managers have more to think about this year than others with a new team entering the league, the Seattle Kraken. The Kraken will conduct their expansion draft prior to the annual draft for young prospects as the team readies to enter its inaugural season (see video: “What’s Kraken in Seatle). General Managers must weigh the importance of short-term sacrifices for long-term success and balance the unique needs of various positions. Similarly, Portfolio Manager have multiple factors to evaluate across various positions to design portfolios that can be successful through multiple times frames.
Equities and commodities for the most part rallied and ended the first half of 2021 with strong, broad-based returns. In fact, the reflation trade has helped the S&P 500 achieve its longest stretch of positive quarterly performance since 2017. Reflation is an upswing in economic growth and inflation caused by easy money and fiscal stimulus. Cyclical sectors including financials, retail and energy outperform as these areas of the market have advanced 55.9%, 96.2%, and 94.0%, respectively since October 2020. During this time, commodities also surged with the Invesco DB Commodity Index returning 52.1%, which handily beat equity indices.
The rapid reopening of the global economy was fueled by excessive amounts of stimulus that helped keep consumer balance sheets on track. In fact, delinquency rates for credit cards are at the lowest levels in history as they declined throughout the COVID-induced lockdowns. The strength in both retail sales as well as the monthly consumer credit report supports a recovery that is well underway. However, the leadership among gainers has shifted.
Declining bond yields seem to have put a pause on the reflation trade that has dominated for nearly a year. Bank reserves at the Federal Reserve stopped expanding in April and long-term interest rates have since been trending lower. Cyclical areas of the market are also beginning to lag major indices. Energy stocks for example are down 7.9% since the beginning of June through mid-July while crude is up 4.9%.
In addition to declining yields, COVID-19 cases have picked-up as the fast-spreading Delta variant makes it way through the global population. Further, liquidity across the U.S. banking system is slowing and the U.S. dollar has stopped declining. All these factors are weighing heavily on a system that rebounded quickly from last March.
At moments like these, we must remain flexible and diversity is often a tailwind. However, we believe the global recovery will play out for the following reasons. (1) Interest rates and the U.S. dollar have experienced significant moves in both directions over the last 18 months. We anticipate that both inputs will settle and provide a more benign setting for investors. (2) An on-going improvement in COVID-19 vaccination roll-outs and treatment will provide more confidence in the durability of the economy. (3) The biggest driver will likely come from the complex deposit system. Despite excess liquidity, banks have parked cash with the Federal Reserve rather than lend. The Fed will likely alter the incentives to get those funds into the economy.
As portfolio and wealth managers trusted with our clients’ financial futures, we must be steadfastly focused on their objectives. This means holding ourselves to higher standards than simply trying to beat short-term averages. Portfolios designed for long-term success avoid long-term failure through investments that may temporarily offset each other in the short-term.
July 06, 2021
NHL Lifestyle Rankings
Smart Money
Players typically consider the opportunity to win, their role on the roster and contract terms as the most important criteria when they evaluate signing with different teams. However, there are other lifestyle factors that may be influential. With assistance from Numbeo, the world’s largest cost of living database, GAVIN ranked all thirty-two NHL cities according to seven significant ...
Players typically consider the opportunity to win, their role on the roster and contract terms as the most important criteria when they evaluate signing with different teams. However, there are other lifestyle factors that may be influential. With assistance from Numbeo, the world’s largest cost of living database, GAVIN ranked all thirty-two NHL cities according to seven significant considerations. Use this tool to learn more about the city in which you live, the city to where you were drafted or to help you choose between multiple free agent offers!
June 27, 2021
Federal Reserve Applies Its Influence on Markets
Market Recap & Boxscore
Equities registered another positive month. The TSX repeated as the front-runner, rising 2.2%, followed by the S&P 500 and MSCI World Indices with gains of 2.1% and 1.1%, respectively. Energy continued to pace the TSX, as WTI Oil climbed for five consecutive weeks. The global re-opening is driving demand while a supportive OPEC and reduced supply from US shale producers have consp...
Equities registered another positive month. The TSX repeated as the front-runner, rising 2.2%, followed by the S&P 500 and MSCI World Indices with gains of 2.1% and 1.1%, respectively. Energy continued to pace the TSX, as WTI Oil climbed for five consecutive weeks. The global re-opening is driving demand while a supportive OPEC and reduced supply from US shale producers have conspired to reduce inventories. Further, demand is supported by the prospect that the European re-opening will strengthen. Meanwhile, ESG concerns are expected to restrain future supply. Accordingly, supply-demand dynamics seem to suggest oil prices will advance. However, OPEC may be induced by attractive prices to release reserves which would temper near-term momentum.
Looking forward, it appears the equity markets are poised to grind higher. Benchmark levels are weaving along all-time highs in an environment characterised by low volatility and tight credit spreads. The VIX hit a new post-pandemic low of 14.02 to end the month while the BofA US High Yield OAS index continues to ride the post-financial crisis low, barely budging even during periods of equity weakness.
Despite equity strength, commodities (excluding energy) tumbled since peaking in May. Predictably, the long side of the commodity trade became overcrowded at the top. As a result, outflows intensified in the most extreme positions when the market was bereft of positive news. Copper was down 5.4% in June and 12.1% from its high. Corn and soybeans are off 15.9% and 20.8%, respectively. China has been accused of triggering the downturn. In addition to deleveraging the economy to slow growth, China announced a planned sale of their strategic copper reserves. Thereby becoming a supplier rather than a major buyer across the commodity complex.
Gold’s recent strength was also tripped in June, falling 6% following the Fed’s announcement discussed below. In short, the prospect for higher rates, would curb inflation and widen real rates, which is seen as a headwind for gold prices.
This month’s Fed announcement caused quick and aggressive moves across markets. On 16-Jun-21, the FOMC announced the timing for tapering could be sooner than anticipated and that rate increases might arrive as early as 2022.
In the February 2021 edition of the Recap & Boxscore, we discussed the potential for downward pressure on short term rates because the US needed to spend much of the $1.6 Trillion in the Treasury General Account (TGA). When money leaves the TGA it pumps liquidity into the banking system, in this environment, it threatens to make short-term interest rates zero or below. To avoid negative rates, the Fed increased the rate that is paid on excess reserves by 0.05% to 0.15% at its recent meeting. This action, along with the threat to adjust rates higher, was perceived as hawkish, because it helps reduce the outflow from money market funds into longer-dated bonds, equities, commodities and so on, further inflating bubble-like markets. Nevertheless, long term rates were forced lower because potential tapering would suppress economic stimulus. Consequently, after the FOMC statement, the yield curve flattened, long-term bonds strengthened and Growth Stocks outperformed Value Stocks, as one would expect in a less expanding economy.
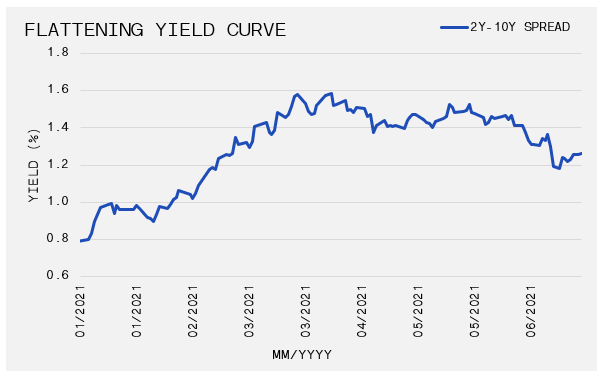
As we move into the second half of the year, inflation and GDP comparisons will become a bit tougher. Therefore, interpreting upcoming data prints will be paramount to tactical asset allocation decisions. A particular interesting development will be the after-effects when 21 states peel away Federal unemployment benefits. These states want to incentivize citizens to return to the workforce ahead of the pandemic response program’s September expiry date. Based on data from the Department of Labour, over three million people will lose an extra $300 per week from late June and beyond. As these individuals return to the work force, employment data could surprise to the upside. An expanding workforce would re-ignite the steepening trade that has dominated most of 2021; and reverse the events of June where the flattening curve sparked the excess returns in Growth Stocks.
May 31, 2021
What’s “Kraken” in Seattle?
Smart Money
On 21-Jul-21, the Seattle Kraken will announce the 30 players that will join the club for the inaugural 2021-22 NHL season. The league’s newest member must select at least one player from each NHL team (except Vegas), while ensuring they select a minimum of 14 forwards, 9 defensemen and 3 goalies. While fans of the NHL will be excited to watch the second expansion draft since 2000, th...
On 21-Jul-21, the Seattle Kraken will announce the 30 players that will join the club for the inaugural 2021-22 NHL season. The league’s newest member must select at least one player from each NHL team (except Vegas), while ensuring they select a minimum of 14 forwards, 9 defensemen and 3 goalies. While fans of the NHL will be excited to watch the second expansion draft since 2000, the 30 players who are moving cities have more to consider than the names of their new teammates. To better understand the new surroundings, check out this short video, or alternatively, take a deeper dive with our Seattle Fact Sheet.
May 26, 2021
Volatile Month Crushes Crypto But Stocks & Bonds Are Unshaken
Market Recap & Boxscore
Markets whipsawed in May, with the S&P 500 swinging over 4% within the month. Despite the volatility and several events that could have sunk markets, the S&P 500 is ending the month in positive territory, up 0.3%. European strength helped power the MSCI World Index to a 0.7% gain. Financials, energy, and materials paced the TSX to a 1.25% return. US Treasury bonds continue to ...
Markets whipsawed in May, with the S&P 500 swinging over 4% within the month. Despite the volatility and several events that could have sunk markets, the S&P 500 is ending the month in positive territory, up 0.3%. European strength helped power the MSCI World Index to a 0.7% gain. Financials, energy, and materials paced the TSX to a 1.25% return.
US Treasury bonds continue to consolidate since the 10-year yield hit its 2021-high in March at 1.74%. Similar to equity markets, which discarded negative news, US yields shook off the US inflation surprise. The Consumer Price Index jumped 4.2% for the 12-months ending in April. This was the sharpest slope since September 2008 and it briefly caused rates to reach 1.70% on 12-May-21. However, that benchmark settled back to 1.56%, as of 26-Mar-21. Bonds have been rising and falling in tandem with equities lately, which has temporarily impaired balanced strategies. The Bloomberg US Aggregate Bond Index is still down 2.2% this year, despite price gains in May.
Front and centre in May was the crypto crash of 2021. Newly minted Bitcoin bulls witnessed the value of their holdings fall by over 50% from the peak on 14-Apr-21. While Bitcoin was the main event, there was nowhere to hide across crypto world as alternatives such as Ethereum and Dogecoin also plunged 58% and 63%, respectively. There has been no shortage of narratives to justify the fall. For example, Elon Musk’s erratic tweeting which included his announcement that Tesla will no longer accept Bitcoin to purchase vehicle. Further, China announced on two separate occasions that financial and payment institutions were banned from facilitating crypto transactions. Additionally, the US Treasury demanded stricter tax reporting standards on cryptocurrency transfers.
Under-the-radar but perhaps most important were two additional factors. The first was around the long-debated backing of stablecoins, which are cryptocurrencies pegged to a specific instrument like the dollar, allowing for the benefits of cryptocurrencies without the volatility. They are also a key piece of plumbing within the $2 trillion global crypto market, facilitating transactions into and out of various cryptocurrencies without cash. The role of stablecoins resembles the traditional market liquidity function provided by money-market mutual funds. During May, Tether, the largest stablecoin, reported its holdings which back and maintain its USD peg. Rather than dollars or Treasuries as they had previously stated, it was reported that over half of its reserves were commercial paper of unknown issuers. This revelation cast doubt on Tether’s soundness and security as a mechanism for liquidity. The second factor was concern that companies such as Microstrategy (NYSE:MSTR) would selling their crypto holdings. Their well-promoted purchases helped stimulate interest in cryptos. However, MSTR and other buyers borrowed heavily to finance their investments. Accordingly, the market became frightened that lenders would pressure MSTR to sell its holdings to ensure that the loans could be serviced and recovered. So far there have not been any liquidity events and the peg on key stablecoins has held. The system appears to have passed this initial test.
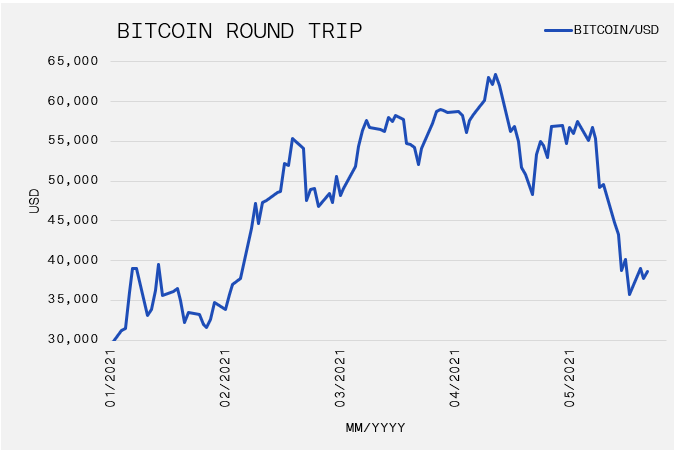
Commodities had another eventful month. Starting with lumber, the futures market hit its daily limit (approximately +4%) multiple times but has since fallen 5.2% for the period. High prices seem to be its Achilles heel. Home builders are stuck with pre-sold homes that are now unprofitable to build. Also contributing to the record number of “homes-sold-not-built” reported in May, was the widespread shortage of appliances, doors, windows, moulding and other supplies.
High-flying grain prices pulled back in May. Corn fell 15% from its 10-May-21 high as China announced the cancellation of some imports. The soft commodity has been powered by seemingly endless demand from the Far East and record dry weather in the US and Brazil, which similarly has started to ease. Oil finished the period up 2.8%, but some of its strength waned as Iran readies sixty-nine million barrels of oil for export when U.S sanctions are lifted. Finally, gold is having a very strong month, up 6.9% to once again breach $1,900/ounce. It broke through its downward trendline since its August peak. Not surprisingly, the move corresponded to rates backing up a bit in May, while the USD also failed to appreciate. Surely the pace of future growth and inflation data, and in turn rates, will decide the extent to which gold continues its run.
April 29, 2021
Commodity Bull Rages
Market Recap & Boxscore
Gains were achieved in April across most global markets. The S&P 500 lead the way, up 5.9%, followed by the MSCI World at 5.4%, while the TSX lagged at 2.7%. The Energy sector was the primary headwind for the Canadian market. It is worth noting that these impressive results were registered despite Archegos’s large-scale blow-up (discussed below), global Covid re-emergence, and rum...
Gains were achieved in April across most global markets. The S&P 500 lead the way, up 5.9%, followed by the MSCI World at 5.4%, while the TSX lagged at 2.7%. The Energy sector was the primary headwind for the Canadian market. It is worth noting that these impressive results were registered despite Archegos’s large-scale blow-up (discussed below), global Covid re-emergence, and rumours of the US Fed tapering faster than expected.
In fixed income, yields backed-off of their 2021 highs. The US 10-Year fell from 1.71% to 1.54% but has recovered to 1.63% as the month wound down. However, Canadian long-term yields diverged and continued to rise as the Canadian central bank bucked the global trend of accommodative policy. We anticipate that inflation readings will reflect the economic re-opening, structural shortages and supply chain de-globalization. As a result, the upward momentum in US yields should eventually resume, but our positioning will be tactical and data dependent.
Likely related to falling yields, gold caught a bid in April, rising 5.3% to $1,775. This will be the first monthly gain for the yellow metal in 2021. The gold price faltered in the first quarter as US Treasury Yields gained, the economic outlook brightened and speculative money chased crypto currencies and other risky assets.
The commodity price rally is widespread, from grains and meats to industrial metals. Our readers are familiar with lumber headlines. In April 2020, lumber was priced under US$260 per board foot. It will close this month near US$1,500. Certainly, accelerating commodity prices are attributed to expectations of a post-COVID demand recovery that outstrips supply after years of underinvestment in capacity. But it is hard to ignore the simultaneous fall in the US Dollar, which is sharply down over 9% on the year. Similarly, the Canadian Dollar continues its torrid pace, up 2.2% in April despite energy weakness, and 14.5% year-over-year. The big move came on 21-Apr-21 when the Bank of Canada became the first central bank to announce tapering of their quantitative easing program, reducing their bond buying program to $3Bn per week (from $4Bn), while also signalling their intention to pull forward interest rate hikes to the first half of 2022. Canada’s ties to commodity prices may have spooked the Bank into believing a more harmful inflation threat was imminent. Alternatively, the Bank may be attempting to cool the red-hot housing market. Regardless, it is difficult to comprehend Canada’s willingness to act first, especially following an extremely accommodative budget, which is sure to leave the country with excess debt to service. Obviously, recent history lessons suggest that any announcement of tightening should be taken with a grain of salt, but in the meantime CAD currency is buying it.
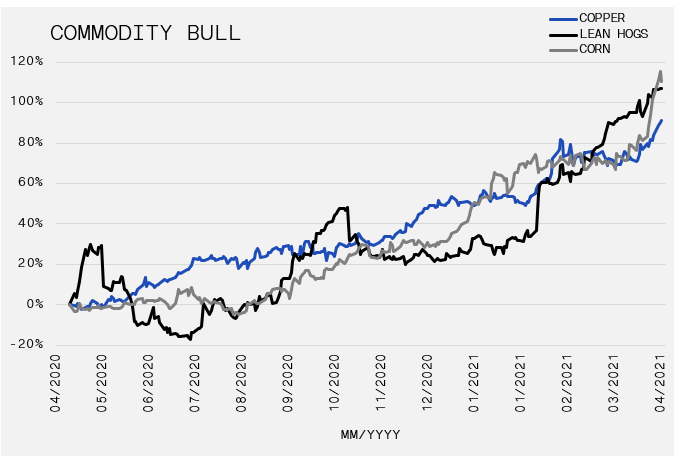
Earlier in April, the frontpage belonged to Archegos Capital Management, run by Bill Hwang. On 26-Mar-21, rumours started to swirl of large-scale forced sales of companies from Chinese tech to Viacom and Discovery, previously boring telecom giants that had run up between 150%-160% in 2021 alone by 20-Mar-21. It later became evident that both the run-up and fall were driven through bank-provided leverage on behalf of their prime brokerage units, whereby the bank provides exposure to the gains or losses of the security in exchange for a set rate, called a Total Return Swap (TRS). This allows the investor to gain exposure to a name without putting up the capital to buy it outright or require ownership to be reported. While TRS is not unique, providing a family office as much as 10x leverage to gain equity exposure of up to $100 billion is nothing short of reckless. Even more so when the office is run by a convicted fraudster. At least eight banks were guilty of the careless loans. Credit Suisse accepted first prize for the greatest misconduct. It reported a loss of $5.5 billion associated with Archegos. Nomura ($2.3Bn), Morgan Stanley ($991MM) and UBS ($774MM) were runners-up. As with any blow-up on Wall Street, more details will become public over time. Some have speculated that Hwang was one of the primary players involved in GameStop and other high short-interest stocks originally attributed to Reddit. 2021 has seen no shortage of ‘interesting’ stock movements so we curiously wait for the craziness to be properly chronicled, while monitoring for any associated risks.
April 27, 2021
Protecting Athletes from Cyber Criminals
Smart Money
The long list of athletes who were scammed by financial advisors grows annually. But dishonourable business managers are only one threat, players need to be increasingly aware of cyber risks. Breaches or hacks on systems that contain confidential information can lead to financial, mental and physical hardships. GAVIN is hosting a webinar in collaboration with Blackcloak, a Concierge C...
The long list of athletes who were scammed by financial advisors grows annually. But dishonourable business managers are only one threat, players need to be increasingly aware of cyber risks. Breaches or hacks on systems that contain confidential information can lead to financial, mental and physical hardships. GAVIN is hosting a webinar in collaboration with Blackcloak, a Concierge Cybersecurity & Privacy Platform that helps protect your reputation, your finances, and your family. Dr. Chris Pierson, Founder & CEO, of Blackcloak, will share the top threats to your security and the defenses to protect yourself. Chris’s remarkable career in cybersecurity includes positions with the FBI and the department of Homeland Security.
April 15, 2021
BIG GAINS & BIG BLOW UPS
First Quarter 2021 Newsletter
One-Year Equity Performance Overshadows Bond Losses – It is difficult to pry one’s eyes away from the one-year equity performance as the year-over-year laps the near bottom that formed in March 2020. The liquidity induced surge that began last April continued into the first quarter of 2021. With the markets focused on a re-opening of the economy, the impressive vaccine roll-out in the...
One-Year Equity Performance Overshadows Bond Losses – It is difficult to pry one’s eyes away from the one-year equity performance as the year-over-year laps the near bottom that formed in March 2020. The liquidity induced surge that began last April continued into the first quarter of 2021. With the markets focused on a re-opening of the economy, the impressive vaccine roll-out in the United States helped to push indices higher. Commodities and commodity-linked companies have been generating outsized returns over the last few quarters. Lumber, in particular, continues to make new all-time highs as the influx of first-time homebuyers combined with lower mortgages rates have overwhelmed supply.
Interest rates in the United States rose roughly 76 basis points (0.76%) during the quarter. Strong economic data and supportive monetary regimes from the big three Central Banks lifted long-dated bond yields globally.

When Crowded Trades Go Bust – Grabbing headlines early in the quarter, the GameStop saga highlighted the repercussions of one-sided, leveraged trades. The fact that many retail traders benefitted from the short squeeze, at the expense of Wall Street professionals, sits well with us. Melvin Capital was at the centre of the GameStop saga and it required a $2.8 billion bailout to survive its reckless use of leverage. Overuse of leverage also played a roll in the forced liquidation of Archegos Capital Management.
GameStop is a specialty electronic hardware and software retailer. With the shift to online gaming, fundamentals were declining for nearly 10 years. The COVID pandemic forced a large portion of their locations to shutdown and it placed the company’s balance sheet into question. However, these factors should have been recognized as “known-knowns”. Formerly a $60 stock, the price traded below $4, short interest was at 150% and the valuation was 3.5x normalized earnings.
However, the company’s fundamentals showed improvements due to a normal course cyclical rebound. Additionally, the board received a face lift, activists intervened and a strategy shift induced more optimism. Nevertheless, professional investors continued to borrow more shares than were available to sell short. Once the price began moving higher, a tidal wave of short-covering (buying back the shares that were borrowed) occurred as GameStop moved from $14 a share in December to over $300 at the end of January. The lack of due diligence and adherence to basic investing guidelines leaves us searching for a reason to show compassion for those on the wrong side of this position.
GameStop is a clear example of focusing only on price action and ignoring shifting fundamentals. The obviousness of it is embedded in the most often repeated rule of short selling – “avoid crowded shorts”. Conversely, for long-only investors, there is no single measuring stick for over-crowded ownership of a stock. However, the Archegos Capital’s liquidation helps explain the perils of over exposure.
Archegos was a $20 billion fund that borrowed heavily and took big, concentrated positions in companies. One of its largest holdings was Viacom. Shares of Viacom tripled in the first two and a half months of the year. However, Viacom’s stock started to weaken at the same time as other significant holdings, including Baidu and Farfetch. The fund had multiple lenders who were apparently unaware of its leverage, which was reportedly 4-times. When the underlying stocks started falling, the lenders began selling massive blocks of shares, which accelerated the losses. The forced liquidation caused Archegos to collapse and it hacked-off approximately $35 billion of value from several US media and Chinese firms in one day.
The early cracks that often appear near the end of a bull market run are starting to pile up. Melvin and Archegos may seem somewhat isolated but we can also point to the Wirecard and Greensill bankruptcies in Europe. These are all very reminiscent of past scandals that marked prior peaks. While we maintain an allocation to growth assets that is near the mid-point of its range, we anticipate that suitable risk-adjusted returns will not be achieved without bumps, ruts and potholes along the way. Accordingly, we are employing more private assets to gain alternative sources of income, diversification, and excess returns.
April 01, 2021
GAVIN Equity Pool
Quarterly Update
While the calendar year turned over, market volatility from 2020 carried forward. Equity markets for the most part fought through the volatility with the S&P 500 returning 6.17% while the technology heavy NASDAQ 100 Index advanced just 1.76%.
Click the link below to continue reading.
March 31, 2021
The Retail Trading Frenzy
Smart Money
COVID-19’s impact on the financial industry has been far-reaching. Some of the notable outcomes that were advanced during the crisis include the craze for special-purpose acquisition companies (SPACs), the rise of environmental, social and governance (ESG) investing and even the emergence of non-fungible tokens (NFTs). However, in our estimation, the most noticeable occurrence h...
COVID-19’s impact on the financial industry has been far-reaching. Some of the notable outcomes that were advanced during the crisis include the craze for special-purpose acquisition companies (SPACs), the rise of environmental, social and governance (ESG) investing and even the emergence of non-fungible tokens (NFTs). However, in our estimation, the most noticeable occurrence has been the retail trading frenzy. “Robinhood” investors have progressed from outsiders to become an impactful force on Wall Street. Click the link below as GAVIN dives into the reasons for the retail emergence and some of the rewards and perils associated with their trading activity.
March 29, 2021
Markets Mark One-Year of COVID in March
Market Recap & Boxscore
March was a strong month overall for equity markets, despite the volatility. The S&P 500 rose 3.9% to another all-time high as of 26-Mar-21. However, the reflation trade took a breather as Utilities (+11%) and Staples replaced Energy and Financials on the monthly podium. Technology and Communications were shunned like immorality. Outside of the US, the TSX rose 3.2%, led by str...
March was a strong month overall for equity markets, despite the volatility. The S&P 500 rose 3.9% to another all-time high as of 26-Mar-21. However, the reflation trade took a breather as Utilities (+11%) and Staples replaced Energy and Financials on the monthly podium. Technology and Communications were shunned like immorality. Outside of the US, the TSX rose 3.2%, led by strength in Financials. The MSCI World Index rose only 2.1%, weighed down by renewed Covid shutdowns. The Japanese Nikkei was relatively flat but its year-to-date gain is over 7%.
The 10-year US Treasury Yield’s captivating rise persisted. At the Federal Reserve meeting on 17-Mar-21, chairman Jay Powell, reiterated their intention to let inflation ‘run hot’ before considering actions to control rates. As month-end approached the posted rate for the benchmark bond was 1.77%, a significant jump from the February close (1.415%). Fortunately, foreign demand was robust at the regular Treasury auctions which allow the market to determine rates without intervention from the Federal Reserve.
The US Dollar, as measured by the DXY, breached 93 for the first time since November 2020. The US is perceived to have a growth advantage because of its comparatively effective vaccination rollout and a quicker economic reopening. However, it is unusual for the stock market to improve while the US dollar gains and interest rates expand.
A consequence of a strong US dollar is typically weak commodity prices. Accordingly, the CRB Index fell 1.4%. Faltering commodities coincided with reports of deleveraging in China and a corresponding 7.2% drop in the Shanghai Composite Index. Previously, strong Chinese demand for industrial commodities propped up prices as the nation exited the pandemic while other countries struggled with soaring virus cases. Now the Western world is beginning to resurface from its economic pause, with consumers eager to spend and unprecedented sums of public support. On 04-Mar-21, Reuters reported China was targeting economic growth of just 6 % this year. This could be the first time in 45 years that the US economy outpaces China.
Speaking of Covid, we would be remiss if we did not stop to recognize that during March, we officially lapped the one-year anniversary of global lockdowns. The S&P 500 traded as low 2,237 on 23-Mar-20; 76% below the close (3,910) one year-later.
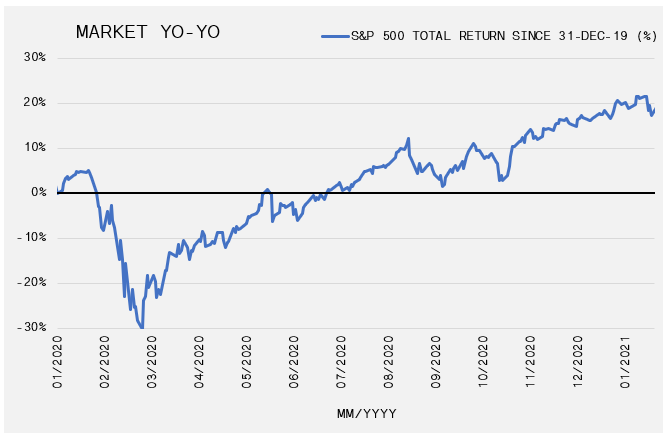
At the time of the trough, the Fed cut its benchmark rate to 0-0.25%, announced plans to support bond markets through its $120 billion monthly Treasury and mortgage-backed securities purchases, and later indirectly purchasing high yield and investment grade corporate credit. The Federal Reserve has added over US$3 Trillion in assets to its balance sheet (up 65%), helping to support US Treasury bond issuance to fuel Covid stimulus and stabilize both the market and the economy. Those that abide by the adage, “Don’t Fight the Fed”, were rewarded for listening. The following list summarizes other notable highlights from the past year.
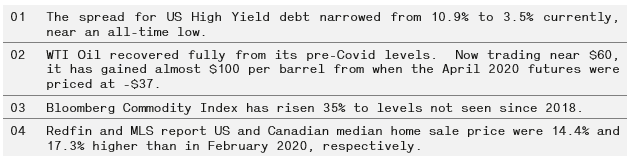
While the speed and size of the economic and market fallout were unprecedented, so too has been the recovery. This serves as another reminder that good times are closer than one can imagine, even when the embers are glowing and your eyes are still burning from the smoke.
February 28, 2021
Foreign Exchange … To The Moon!
Smart Money
The vast majority of professional athletes require money in various currencies throughout their hockey careers. Unfortunately, too many players are careless when they exchange money between currencies. As result, they incur an enormous expense by using traditional banks. By simply working with an independent foreign exchange broker, players can save 3-5% relative to the rates posted b...
The vast majority of professional athletes require money in various currencies throughout their hockey careers. Unfortunately, too many players are careless when they exchange money between currencies. As result, they incur an enormous expense by using traditional banks. By simply working with an independent foreign exchange broker, players can save 3-5% relative to the rates posted by a traditional bank. Click the link below to watch our case study, illustrating how big of an impact this can have throughout the duration of a player’s career.
February 25, 2021
Commodities Gain But Markets Struggle As Month Winds Down
Market Recap & Boxscore
Echoing January’s tune, global equity markets stumbled in the final week of the month, this time after a very strong showing for most of February. Despite this, most markets remained positive in February, with the TSX resuming its leadership on the back of a strong commodity showing, up 6.1% for the month. The S&P 500 Index rose 2.7%, led by Energy (+ 17.7%) and Financials (+ 9.4%...
Echoing January’s tune, global equity markets stumbled in the final week of the month, this time after a very strong showing for most of February. Despite this, most markets remained positive in February, with the TSX resuming its leadership on the back of a strong commodity showing, up 6.1% for the month. The S&P 500 Index rose 2.7%, led by Energy (+ 17.7%) and Financials (+ 9.4%) sectors, while rate sensitive utilities lagged, down 5.3% for the month. The MSCI World Index lagged, rising 1.6% as Europe and China trailed North American Indices.
Market darling Tesla has been on its back foot since it announced its $1.5 billion purchase of Bitcoin. Tesla fell 23.9% during February, dropping below the price at which it was included in the S&P 500 Index. Related to this, Ark Investments experienced the downside of the momentum trade. Tesla represents 10% of flagship ARKK exchange-traded fund, which triggered the 6.9% drop in February. Ark focuses on innovative, small capitalization companies. Accordingly, as Ark’s assets under management have increased from $10 billion to $50 billion in 2020, the companies within Ark’s portfolio have likewise soared. However, if outflows continue, Ark will be forced to sell these positions. The size of outflows will accelerate the slide in the price of the underlying holdings. This creates a negative feedback loop for Ark, and potentially markets in general.
After a brief rise to start the year, the USD fell 50bps during the period. Despite the modest change, commodities moved up aggressively, with copper leading the way, rising an astounding 20.2%, contributing to a 69% year-over year gain. Lumber similarly rose 19.8% to a new all-time high above $1,000, and its one-year return is now 119%. Soft commodities produced a similar story, as sugar, corn and cotton all rose over 10% during the month. Soybeans and wheat were up 6.7% and 5.9%, respectively. The crisis in Texas supported the Energy sector as the ensuing supply chain issues, along with refinery blockages, propped gasoline and oil by 21% and natural gas prices by 14.5%. It is not often that commodities print 20%+ monthly increases, especially after a period of sustained strength. Many are still dismissive of inflation, and the tepid January Consumer Price Index report of 1.4% year-over-year provided naysayers more confidence in their status quo view. Nonetheless, it is doubtful that CPI can continue to show miniscule gains. Grocers and restaurants will need to pass along price increases to counteract rising soft commodity costs. Further, housing rents – which account for 7.9% of the inflation basket – are climbing. The renter base is growing due to the unaffordability of homes, housing shortages and migration to suburbs. As economic data begins to lap weak readings during the depths of the Covid-19 shutdown, CPI should quicken.
While the CPI has remained stubborn, markets have not been fooled. We shed some light on the move up in long-term yields in the January letter, and this month momentum continued to build as the 10-year and 30-year yields rose 43 and 50bps, respectively, to 1.46% and 2.29%. As long yields continue to rally, the short end has remained persistently low, which has pushed both nominal and real yield curves up aggressively (see below). Part of this is intuitive as the long-end is more sensitive to inflation and growth expectations, while the short-end is more sensitive to Fed control.
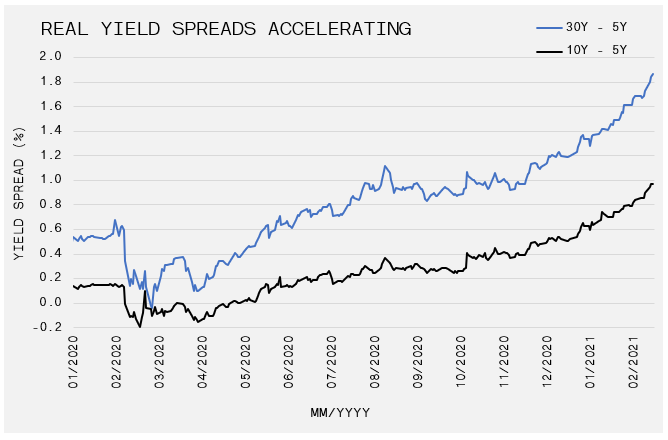
The Fed’s discipline will be tested in the coming months as short-term rates are at risk of becoming negative. Negative interest rates make it less appealing to hold cash and induce spending, lending and speculation, while curtailing bank profitability and creating widespread uncertainty in the market. Treasury Secretary Janet Yellen outlined plans to start drawing the $1.5 trillion Treasury General Account down to $800 billion by the end of March. This flood of reserves will hit bank balance sheets, as commodity prices intensify, and before Biden’s $1.9 trillion inflationary infrastructure plan is due in April. All things considered, the Fed could be squeezed into the unenviable position of negative short-term rates and rising long-term Treasury yields.
January 30, 2021
The NHL Financial Primer
Smart Money
Following months of negotiation and uncertainty, the NHL has finally resumed. To ensure a player is financially prepared for this unique season, GAVIN updated our annual NHL Primer. The exhibit provides current and relevant financial data for the season; including pay periods, escrow, income tax rates, NHL group benefits and retirement contributions. Feel free to share The NHL Primer;...
Following months of negotiation and uncertainty, the NHL has finally resumed. To ensure a player is financially prepared for this unique season, GAVIN updated our annual NHL Primer. The exhibit provides current and relevant financial data for the season; including pay periods, escrow, income tax rates, NHL group benefits and retirement contributions. Feel free to share The NHL Primer; and, as always, let us know what you think.
January 28, 2021
2021 Starts with The GameStop Show
Market Recap & Boxscore
Global indices started to feel some indigestion in the final week of January. Despite a 2% fall on the 27th, the MSCI World and S&P 500 still managed to rise 1.8% and 1.7% during the period. The TSX lagged, falling 0.6% during the month as the Canadian index gave back some of its outperformance during the final stretch in 2020. Similarly, the USD was weak as 2020 wound down but ...
Global indices started to feel some indigestion in the final week of January. Despite a 2% fall on the 27th, the MSCI World and S&P 500 still managed to rise 1.8% and 1.7% during the period. The TSX lagged, falling 0.6% during the month as the Canadian index gave back some of its outperformance during the final stretch in 2020. Similarly, the USD was weak as 2020 wound down but it pivoted in 2021, rising 0.5% and seemingly capping equity momentum.
President Joe Biden’s $1.9 trillion spending package, that includes $2,000 stimulus cheques, lifted expectations for future economic growth. This effort contributed to a boost in the 10-year yield from 0.96% to 1.14%. As this recap is being written, the rate is settling in at 1.03%. The US dollar and rates continue to be a primary focus due to its impact across assets. Federal Reserve Chairman Jerome Powell commented this week that the U.S. economy was a long way from full recovery and that tapering is not on the agenda for 2021.
On the commodity front, following a strong December where gold attempted a breakout to the upside following four months of weakness, the yellow metal gave back some of its gains in January, losing 1.8%. The upward momentum for oil carried on, as WTI rose 10.7%. Inflation has been a repeating theme in our monthly letters, and it is now gaining traction in broader financial circles. Sustained strength in key food input commodities like corn, wheat, and soybeans (up 18%, 8.5% and 4.7%, respectively) in January reinforced the inflation narrative. Industrial metals like copper and iron were closer to flat but still held tight after a major bull run through much of 2020. Despite this, the Consumer Price Index (CPI) rose only 1.4% year-over-year in December, (1.6% excluding food and energy) signalling inflation is still stalling. However, with inputs rising, it will be tough for the food index to remain stagnant. Moreover, the base effects of reduced rent in key urban centres where people are exiting should also be offset by increased rents on the back of home price appreciation that has been between 5-10% across several US states. Inflation implications across many asset classes is massive, as is the Fed’s reaction once inflation starts to creep above 2% on a sustainable basis.
Coming into 2021, GameStop (GME), a primarily bricks and mortar video game store, experienced a decline in operations for some time, and its stock followed suit, dropping from a high of $50 in 2013 to $19 to end 2020. Short-sellers, investors who bet on a fall in price, piled into the trade. More than 100% of the available shares were “sold short”. The price frenzy only hit news agencies this week, but the story actually started in August 2020, as activist investors like Ryan Cohen, the former CEO of Chewy Inc., started buying shares, leading to a Board shakeup and shift in the business’s focus. This is when the GameStop hype accelerated because WallStreetBets (a subreddit where participants discuss stock and options trading) discovered the combination of short interest and the promise for improving fundamentals. Millions of WallStreetBets users take concentrated positions to drive dealers to hedge through share purchases, and hedge funds to rush to cover shorts. This activity can produce aggressive and exaggerated price movements. Accordingly, a monumental 20x year-to- date return ensued. As a result, at least one prominent hedge fund, Melvin Capital, was forced to take a $2.75 billion infusion of cash from Citadel Securities and Point72 to avoid failure. While Melvin is the poster-boy, reverberations across markets forced de-leveraging across capital markets, ultimately contributing to the S&P 500’s 2.4% slide on 27-Jan-21. On the same day, GME was up 135%.
“Redditors” have also set their sights on AMC (the theatre operator) and bygone market darling Blackberry. Surely opportunistic funds have joined the rally and added fuel to the fire, and the underlying tone within the message boards is not solely of money-making, there is a tone of class warfare, sending a message to those seen as taking advantage of retail investors for years. Wall St. wasted no time honouring their reputation, plotting to temporarily shutdown various subreddits, while brokerages across North America delayed or halted trading in these names. More recently Robinhood, a retail brokerage, banned trading in popular Reddit names. Time will tell how broad the impact will be, but it seems the show is still in Season 1.
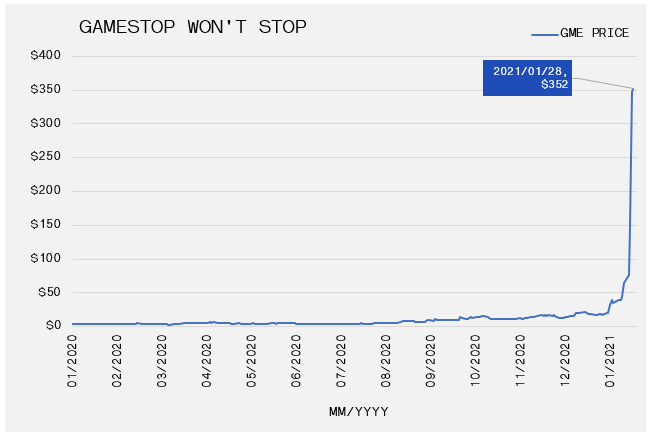
January 15, 2021
A Trillion Here, A Trillion There
Fourth Quarter 2020 Newsletter
Declining US Dollar Lifts Risk Assets – The fourth quarter of 2020 may be an after thought for most people, but it produced gains that lifted indices back into positive territory and some to record highs. While government support and Central Bank stimulus started the recovery, the US dollar’s decline provided further support for a risk asset rally. A lower US dollar is a reprieve for ...
Declining US Dollar Lifts Risk Assets – The fourth quarter of 2020 may be an after thought for most people, but it produced gains that lifted indices back into positive territory and some to record highs. While government support and Central Bank stimulus started the recovery, the US dollar’s decline provided further support for a risk asset rally. A lower US dollar is a reprieve for global markets as much of the world’s debt is denominated in greenbacks as well as most global trade. The lower US dollar is particularly beneficial for Emerging Markets, but the S&P 500 also gains because most of the constituents are multi-national firms.
Similar to the fourth quarter of 2019, the US Treasury Yield Curve steepened in the fourth quarter. This time however it was from a much lower base as the 10-year Treasury yield ended the year at 0.96% versus 1.92% a year early. Still, the positive momentum from mid-year lows appears poised to carry into 2021.
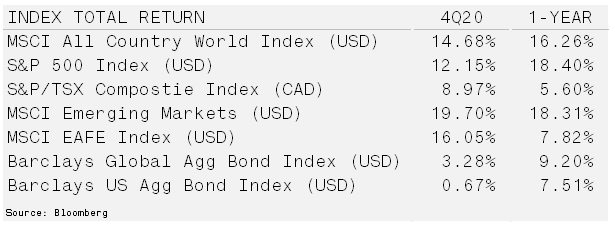
Trillion Here, A Trillion There – On 25-Mar-20, the US Senate passed the $2.2 trillion CARES Act, a stimulus package designed to speed up financial relief across the United States. Many developed markets followed suit; Canada rolled out an $82 billion economic stimulus package. However, the size and breadth of the relief package was a surprise, especially coming from a largely liberal and capitalistic society. Government spending for economic relief due to the COVID-19 pandemic has rivalled that of war time spending. The packages were not without reason, as financial aid was required for individuals whose ability to produce income was lost. But the consequences of this stimulus, both good and bad, are likely to play out through 2021.
Nearly $1 trillion of the capital was set aside for small businesses that were impacted by the virus lockdowns. While this helped to pay the bills, much of the capital was a loan and only “kicked the can down the road”. Similarly, forbearance programs for mortgages and student loan forgiveness continue to receive this same delay tactic that eventually will come home to roost. For now, the leniency on rents, mortgages and other loans will continue to support risk assets.
In late December, lawmakers passed a $900 billion pandemic relief bill, just before several of the CARES Act aid programs were set to expire. The bill was highlighted by direct stimulus payments of $600, half the amount provided by the first round of cheques. After firmly taking control of Congress, it did not take long for Joe Biden and the Democrats to pump money into the economy and to increase spending to contain the coronavirus pandemic. The American Rescue Plan, announced on 14-Jan-21, is valued at $1.9 trillion and it includes more direct payment to households, a $15 per hour minimum wage and an expansion of jobless benefits.
When the Economic Impact Payment stimulus cheques were sent in spring 2020, apparently 36% of recipients used it for savings and investing. It is anticipated that much of the recent government income will find its way into brokerage accounts again. Therefore, the influence of retail traders should remain a theme for 2021. Adding this to the current market structure which encompasses high valuations and a market dominated by passive investing means that volatility will remain high. The passive management effect causes equities to trade as though they are a lot less liquid. In turn, movements to the upside or downside will be amplified.
Two of our long-term equity themes are materializing. First, cannabis stocks are soaring as the Democrats are poised to follow through on inter-state legalization. Second, commodities are reaping the benefits from a lower US dollar and the additional stimulus will likely pressure the greenback further. However, we remain cognizant of the “dollar smile” theory (the currency increases when the economy is very strong or very weak) and we will adjust exposure accordingly.
Global economic data is poised for a rebound in the first half of 2021. With interest rates climbing, our short-duration call is once again protecting our portfolios. We expect rates to gradually rise although, but volatility will be rampant when at extremes. Should rates collapse again we turn to both gold and alternative investments for support as we are not mandated to hold negative yielding securities. Rest assured that we will remain nimble during volatile markets.
December 31, 2020
WJHC ALL-STARS STRIKE NHL GOLD
Smart Money
Each December, the hockey world shifts its attention to the World Junior Hockey Championships. The tournament provides an opportunity for viewers to catch a glimpse of tomorrow’s NHL superstars. But, how successful do the junior hockey superstars become at the highest professional level? Click the link below to see the career earnings of some of the past World Junior All-Stars.
December 22, 2020
Stocks Are Stronger As Scary Year Shuts Down
Market Recap & Boxscore
The S&P 500, TSX and MSCI Indices rose 1.3%, 1.0%, 1.0%, respectively, for the period ending 23-Dec-20. Throughout the year we have become accustomed to seeing technology move opposite to energy and financials. In December, these three categories were the sector leaders; tech (+7.8%), energy (+6.1%) and financials (+5.2%). The laggards were interest rate sensitive industries like ...
The S&P 500, TSX and MSCI Indices rose 1.3%, 1.0%, 1.0%, respectively, for the period ending 23-Dec-20. Throughout the year we have become accustomed to seeing technology move opposite to energy and financials. In December, these three categories were the sector leaders; tech (+7.8%), energy (+6.1%) and financials (+5.2%). The laggards were interest rate sensitive industries like utilities and real estate as longer-term rates continued to rise.
The move in energy stocks was driven by sustained strength in oil. WTI rose 3.4%, bringing its two-month leap to 27.9% from its low in early November. We are also witnessing similar albeit more muted moves across the commodity space, likely driven by uninterupted weakness in the US dollar. The DXY once again fell 2% during the period. However, a reversal in the greenback was gaining traction as Christmas day approached. After Congress announced a Covid relief bill that underwhelmed, the outgoing President Trump announced his intention to veto the bill unless the amount of support to citizens increased to $2,000 from the original $600.
The climb in the US 10-year yield carried on throughout the month, gaining 8.3bps to 0.925%. While it is still a full 1% below the rate from one year earlier, the sustained increase over the past five months is noteworthy. Upward momentum is a derivative of future growth expectations or inflationary forces, or a combination of the two. The US Core CPI inflation rate hit 1.6% in December. The Core rate excludes things like food and energy which are typically more volatile. Nevertheless, while energy is excluded, it is a core input for the majority of goods feeding the inflation rate. As such, as we enter 2021, the year-over-year comparisons for oil prices may become increasingly supportive of inflation. Further, strength in key inflation-linked commodities like copper suggest that inflation may exceed the market’s expectations. Copper prices reached a 7-year-high during the period. Gold prices are supportive of this inflation thesis. Nominal rates rose but real rates (nominal minus inflation breakeven rate) have resumed their downward trend. Gold’s correlation with real rates held true as it rose 4.6%. The real interest rate of -1.08% as of 22-Dec-20 is still a considerable distance from the -5.86% level reached in May 1980.
We are still alarmed by the eye-popping volume of IPO transactions in the back half of 2020. As the chart below shows, the 407 transactions completed to date in 2020, combined with 13 yet to come to close the year, will be the largest transaction year on-record since 1999, and 53% higher than the next highest year since the tech boom. The IPO stampede has been accompanied by the explosion of Special Purpose Acquisition Company (SPAC) – 246 new SPACs were created this year, compared to 59 in 2019, the next highest year. In a SPAC, a sponsor, typically an operator or investor well-known to the public, will raise funds in the form of cash with the intention to purchase a company to take them public at some later date. Some high-profile companies which have been taken public via this avenue have been OpenDoor, DraftKings, and Virgin Galactic.
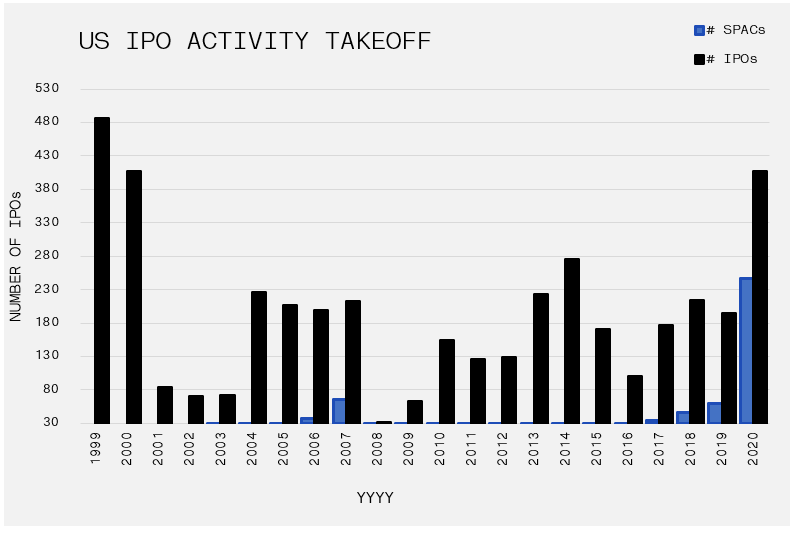
Up until 2020 companies largely decided to remain private due to the inherent advantages in the private ecosystem, so the massive uptick raises many questions. As of 11-Dec-20, PWC reports that on aggregate IPOs have performed an average of 76% in 2020 vs. 13% for the S&P 500. Certainly, investor demand to chase returns has been strong. Further, debt markets have raised a combined $2.5 trillion in 2020, compared to an average of $1.9 trillion from 2016-2019. Included in that are high yield bonds which gathered more than $400 billion – setting a fresh record despite the global pandemic. There a collection of elements that spurred this activity, undoubtedly the trillions of dollars of liquidity injected into the market to help stem the pandemic is a factor.
Looking forward to 2021, the consensus believes the vaccine will provide a boost to economic activity and extend gains in capital markets. However, given the liquidity and stimulus that propped prices in 2020, we wonder if the current calendar year already borrowed much of the gains from 2021.
December 03, 2020
Pandemic Forces NHL Players To Get Serious With Their Money
Smart Money
Since the NHL shutdown on 12-Mar-20, players have faced waves of uncertainty. Most recently, less than four months after signing a new collective bargaining agreement, the owners are asking the players to surrender more salary. Refusing to budge, both sides find themselves in a situation that may threaten the entire hockey season. The insecurity heightens the urgency for players to re...
Since the NHL shutdown on 12-Mar-20, players have faced waves of uncertainty. Most recently, less than four months after signing a new collective bargaining agreement, the owners are asking the players to surrender more salary. Refusing to budge, both sides find themselves in a situation that may threaten the entire hockey season. The insecurity heightens the urgency for players to review their financial situation and re-evaluate their game plan for accumulating post-hockey savings. Check out the video below to start getting serious with your money.
November 27, 2020
Vaccine Prospects Invigorate Stocks and Commodities
Market Recap & Boxscore
Leading up to the US election, overall volatility risk premium increased as investors generally flocked to protection. The election results did not produce chaos, despite President Trump’s ongoing theatrics, leading investors to unwind their safeguards. As can be seen below, volatility has fallen, and markets recaptured its upward momentum heading into year-end. For the period, the S&...
Leading up to the US election, overall volatility risk premium increased as investors generally flocked to protection. The election results did not produce chaos, despite President Trump’s ongoing theatrics, leading investors to unwind their safeguards. As can be seen below, volatility has fallen, and markets recaptured its upward momentum heading into year-end. For the period, the S&P 500, TSX and MSCI Indices rose 11.1%, 11.6% and 12.4%, respectively. Interestingly, leading the charge were sectors that prior to November were consistent laggards, those being energy, financials, industrials and materials stocks. One trade that has been prevalent for most of 2020 has been the long tech/momentum, short negative momentum, particularly “long Nasdaq, short Russell 2000”. Since the Nasdaq’s 02-Sep-20 peak where it was outperforming the Russell 2000 by 50% on a year-to date basis, relative performance has tightened substantially, reducing the gap to 30% as of 27-Nov-20. Much of this is due to positive vaccine news, expectations for better-than-expected growth into 2021 and perhaps a partial unwind of the relative trade. With the Nasdaq once again breaking through its 2020 high to end the month, it will be interesting to see how these trades evolve into 2021 as traders reset positions and expectations.
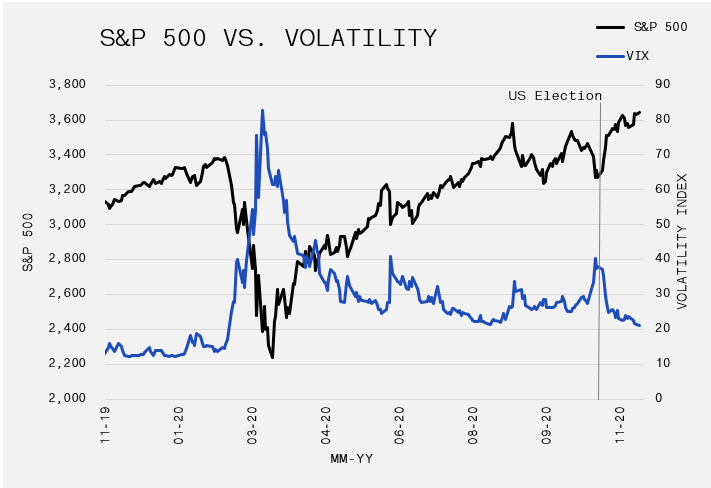
Related to the above, commodities have continued to outperform throughout the month as the US dollar dropped to a new 52-week low versus a broad currency basket. Importantly, leading the charge in November were copper and oil – key industrial inputs. Copper rose 12.6% for the period, rising to levels not seen since 2014. Supply disruptions in Chile and Peru, where 45% of global copper is produced, contributed to the price increases. However, global Purchasing Managers’ Index (PMI) measures have been surprising to the upside, which indicates demand is underpinning copper prices as well. Similarly, oil as measured by WTI rose 20.7% as economic optimism helped to reverse an overall bearish position amongst investors. The strength stretched beyond copper and oil though, with industrial metals like steel and aluminum leaping 11.9% and 9.7%, and soft commodities like soybeans and corn rising 9.6% and 1.6%. Soaring commodities helped extend Canadian dollar gains relative to the US dollar, as the exchange rate dropped to US$1.00:C$1.29, which has been a consistent resistance level over the past few years.
US Treasury Bond yields got a lift from growth expectations, as the 10-year approached 1.0% before retracing to 0.85%. In addition to the growth narrative, the absence of foreign purchases of US Treasuries has made it difficult for demand to soak up record issuance, which leaves the Federal Reserve as the primary source of end demand. The Fed’s massive bond buying is needed to maintain stability in capital markets and it helps convince market participants that yields will remain contained.
Interestingly, while the correlation between the USD dollar and commodities was typically negative during the period, the relationship between the Greenback and gold shifted to positive. The price for gold slumped 6.1% to $1,785 per ounce. Although gold found rhythm with the US dollar, it continues to have a push-and-pull association with real yields, the US Treasury yield less inflation rates. The plunge in real rates from 0.1% to -1.1% was a major driver for gold’s 36.4% climb in the first eight months of 2020. However, the 10-year bond yield’s steady rise has forced real yields to retreat which knocked gold backwards. More recently, even as real yields steadied, gold responded in an unusual manner by accelerating to the downside. But, this late in the year, no one should be startled that 2020 is offering more surprises. As correlations begin to break down in the very short-term, a long-term trend in gold prices will be determined when the historical factors re-establish their prominence; (1) the appeal of the US dollar, (2) real bond yields, and (3) the equity risk premium.
October 30, 2020
A Guide to the US Election
Smart Money
In 2016, the citizens of the US stunned the world when they elected Republican candidate, Donald Trump, into the White House. Almost four years later, President Trump is again trailing in the polls as election day approaches. The race is sufficiently tight, and the incumbent’s unpredictable conduct is signaling that the outcome will not be known until well after the 03-Nov-20 election...
In 2016, the citizens of the US stunned the world when they elected Republican candidate, Donald Trump, into the White House. Almost four years later, President Trump is again trailing in the polls as election day approaches. The race is sufficiently tight, and the incumbent’s unpredictable conduct is signaling that the outcome will not be known until well after the 03-Nov-20 election date. Nevertheless, looking past the disruption, we know each party’s policies will impact players differently. The content below discusses several issues that are top of mind for NHLers.
October 28, 2020
Unpredictable Election Is Problematic For Investors
Market Recap & Boxscore
Volatility accelerated in October as the US approaches one of the most charged elections in history. Global stock markets started strong in October, conceivably because a Democratic sweep would provide much needed stimulus to the US economy. However, the S&P500 dropped 7.5% from 12-Oct-20 to 28-Oct-20 as Covid-19 fears resurfaced and stimulus doubts emerged. While confirming the i...
Volatility accelerated in October as the US approaches one of the most charged elections in history. Global stock markets started strong in October, conceivably because a Democratic sweep would provide much needed stimulus to the US economy. However, the S&P500 dropped 7.5% from 12-Oct-20 to 28-Oct-20 as Covid-19 fears resurfaced and stimulus doubts emerged. While confirming the intentions of all market participants is impossible, with the Volatility Index (VIX) touching 40, anxiety and apprehension is prominent as the 03-Nov-20 election nears.
Forecasts for a slower than anticipated rebound in demand for Oil caused WTI prices to drop 6.7%. Surging COVID-19 cases and flush oil inventories provided the setting for the weak outlook. Interestingly, bonds did not provide the protection on which investors have come to rely, with the 10-year yield rising 11bps on the month. Nevertheless, the Fed remains active as officials have emphasized that they will continue to buy Treasuries to control the yield curve. Gold was largely flat during the period, despite the bump in yields, but it slipped as the pullback in stocks deepened.
Third-quarter earnings season is underway, and the market’s reaction has been surprising. Stalwarts, like Microsoft and Mastercard, were both slammed despite strong results, while many other companies we cover finished in the red following beats and increased guidance. Investors were unhappy with the absence of guidance from Apple, whose shares now trade about 20% below its 52-week high ($137.98).
With noise around the election driving volatility, it is important to highlight the significant contests on the 03-Nov-20 ballots. There are three key battles to monitor, the first being the Presidency. Next is the vote for who controls the House of Representatives (the House), while the third is for the Senate. The President and the entire House are up for election, but less publicized is the battle for the Senate. Thirty-five of the one-hundred Senate seats are available. The Republicans need to hold 23 to retain their slim 53-47 majority. This is important as the Senate is responsible for approving motions passed by the House and any single member can have a key impact on the decisions of the US government. The odds of a Democratic Senate were surging into September. However, recent polls and betting markets are forecasting more of an even race which translates to more uncertainty for the markets and less confidence in future fiscal support. A similar pattern has surfaced around the Presidential race, which helps explain the subsiding conviction in a Democratic sweep. The only race that seems to have any sense of clarity is for the House, where the end result is reflects the popular vote rather than the electoral college (President) or the decision of a minority of specific seats (Senate).
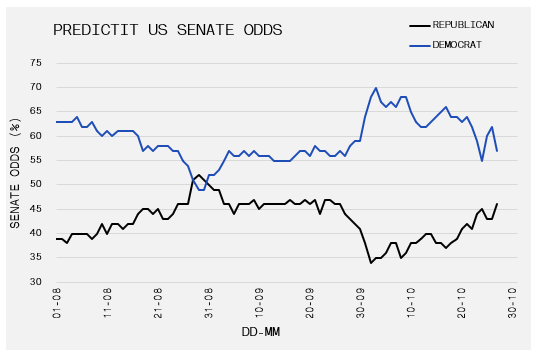
The Democratic party are favoured for those who desire a prompt and sizable fiscal stimulus bill. House Democrats proposed a $2.2 trillion package whereas the Trump administration most recently offered a $1.9 trillion tender. As such, a Democratic President/Senate combo would ensure a quick and hefty deployment. The additional stimulus would directly aid the economy. We witnessed the impact the first round of relief had on US consumer spending and in the stock market as newly minted Robinhood investors spent their cheques. On the other side, Democratic leadership is associated with higher taxes at both the corporate and personal level. A Republican sweep casts doubt on the size of the package but comes with it a status quo and possibly more favourable tax implication. Either way, the ability to predict the outcome is hard enough, as evidenced by the swings in polling. Accordingly, accurately forecasting the market’s reaction to a temperamental result adds another layer of complexity. Consequently, we are focused on designing a diversified portfolio with ample liquidity. Our objective is to minimize negative impacts by remaining nimble and buying opportunistically.
October 01, 2020
Election Outlook Obscures The Prospects for 4Q20
Third Quarter 2020 Newsletter
Bond Yields Firm As Domestic Equities Rally – Global equities gained in the third quarter but performance was uneven among geographic regions. Aggressive monetary and fiscal stimulus measures helped asset prices in the United States while lockdowns in Asia neutralized COVID-19 and fueled markets. As fiscal stimulus measures ran their course and children returned to school in September...
Bond Yields Firm As Domestic Equities Rally – Global equities gained in the third quarter but performance was uneven among geographic regions. Aggressive monetary and fiscal stimulus measures helped asset prices in the United States while lockdowns in Asia neutralized COVID-19 and fueled markets.
As fiscal stimulus measures ran their course and children returned to school in September risk appetites slipped. U.S. markets fell 4%-6% during the month but are equivalently within all-time highs. European equities were flat-to-down as exposure to underperforming financial and energy sectors prevented gains. Despite heavy weights to similar sectors, the Canadian S&P/TSX Composite advanced nearly 5% as metals, mining and other commodity related equities surged.
Most commodities received a bid as the U.S. dollar fell against major currencies (excluding the Yen). Lumber attracted most of the limelight as it broke through previous highs, topping out at $1,000 before finishing the quarter at $612, gaining 41%. Oil prices were the first commodity to falter, ending the quarter flat after peaking at the end of August.
Gold drifted higher but came under pressure as bond yields began to firm and the U.S. dollar found a temporary bottom. Higher bond yields without inflation will limit gold’s upside and likely upset equity valuations.
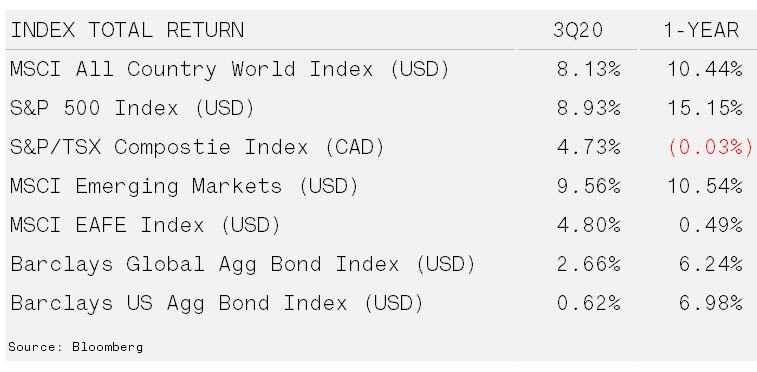
The Implications of Elections – Conventional wisdom says that uncertainty is bad for markets. Intuitively this makes sense since confidence in an outcome, or at the very least a stable outlook, should lead to more investment decisions today. With the U.S. election (03-Nov-20) just around the corner equity markets have started pricing in the risk of political instability. This is most evident in the VIX (Volatility) Index, which has anticipated a period of uncertainty in the fourth quarter since the market decline in March. This marked a turning point for expectations about the election’s outcome. President Trump could no longer use the stock market as the gauge for his success during the Coronavirus Crash.
Despite the stock market recovery, the mishandling of the outbreak has cast the Democrats into a healthy lead. Forecasts are now suggesting a Blue Wave will give Joe Biden the presidency and both houses of Congress to the Democrats. A “sweep” may unsettle the market because of the absence of the checks and balances that demand negotiation and compromise, which pulls either wing toward the centre. Instead swift, self-serving decisions may present themselves over important rulings such as the current anti-trust recommendations for big-technology firms. The Democratically controlled House of Representatives just released a massive overhaul that would have major consequences for the largest publicly traded companies, Amazon and Apple. This type of change could be a major catalyst that causes a change in market leaders as we highlighted in our October 2019 newsletter.
Nevertheless, declaring a loss for Trump and the Republicans is still premature. The possibility remains that the gap can be overcome, or it can be tightened enough to contest the election results. A contested election could arise from a simple delay in counting of mail-in ballots or a more serious scenario such as voter fraud. The U.S. presidential election in 2000 was contested when close results in Florida led to a vote recount by hand. The recount ended up in the 9-person Supreme Court. While a delay similar the Bush-Gore controversy may disrupt markets in the short-term, more worrying are the results of a recent Hofstra University survey. This survey showed a significant rise in the number of Americans, both Democrats and Republicans, who feel it is justified for their party to use violence to advance political goals.
While election outcomes and legislation can have adverse impacts on specific cohorts of markets, in general equity markets typically prosper regardless of the political party in office. Studying historical returns, if you exclude the most recent 16 years, the correlation between presidential party and stock market returns is non-existent. The Great Financial Crisis and subsequent rebound sway the results slightly in favour of the Democrats. However, most evident is that returns have more to do with the business cycle than presidents.
Our tactical decision-making process is more aligned with the business cycle than election outcomes. These maneuvers are smaller in nature to strategic allocation decisions, which align with client risk tolerances, but these are never single point decisions. Factors such as valuation, fundamentals and technical indicators are also incorporated into investment decisions. Take big-technology firms, we view the proposed anti-trust investigation combined with valuations as a major concern but are respecting the strong fundamentals and technical price charts.
October 01, 2020
GAVIN EQUITY POOL
Quarterly Update
The third quarter was a tale of two halves as reopening the economy spurred a lift in economic data early on. Meanwhile, the return to more normal daily routines, and especially school, produced a large increase in COVID case counts.
Click the link to continue reading.
September 30, 2020
Welcome to the NHL
Smart Money
With the conclusion of the 2020 Stanley Cup Playoffs, all eyes in the hockey world will now shift to the upcoming NHL Entry Draft. Over the course of two days (October 6th and 7th), 210 young men will be selected to join 30 NHL franchises. In addition to joining a new team, these young players will find a new home. Click the link below to see some interesting facts about the cities se...
With the conclusion of the 2020 Stanley Cup Playoffs, all eyes in the hockey world will now shift to the upcoming NHL Entry Draft. Over the course of two days (October 6th and 7th), 210 young men will be selected to join 30 NHL franchises. In addition to joining a new team, these young players will find a new home. Click the link below to see some interesting facts about the cities selecting in the top 10 of next month’s draft
September 28, 2020
September Slump Sets Stage for the Election & Fourth Quarter
Market Recap & Boxscore
After five consecutive months of gains across US and Canadian indices, the brakes were firmly applied to the rally. The S&P 500 fell 5.2% for the period with losses led by Financials and Technology. The MSCI World and TSX Indices provided little refuge, down 4.7% and 3.7%, respectively. Notably, when the S&P 500 and Nasdaq 100 scaled new peaks in August, their respective measu...
After five consecutive months of gains across US and Canadian indices, the brakes were firmly applied to the rally. The S&P 500 fell 5.2% for the period with losses led by Financials and Technology. The MSCI World and TSX Indices provided little refuge, down 4.7% and 3.7%, respectively. Notably, when the S&P 500 and Nasdaq 100 scaled new peaks in August, their respective measures of implied volatility also rose in tandem. Concurrent increases in equity and volatility gauges are uncommon. Accordingly, the September slump was not alarming. The US presidential election date is fast approaching, and volatility is expected to remain elevated.
Gold and silver lost their lustre in September as well, sliding 3.4% and 14.7%, respectively, as the USD strengthened. WTI oil tumbled 6.9% but most of the weakness occurred early in the month, slumping from $43 to below $37 by 08-Sep-20, but recovering to $40.60 at press time. The timing of the rebound coincided with Saudi energy minister’s taunt to oil short sellers. Following the OPEC+ gathering, Prince Abdulaziz bin Salman invoked Dirty Harry, with a “Make My Day” warning directed at those who wished to gamble on declining prices. Elsewhere, bonds remained flat through the back half of September during the more aggressive stage of the equity selloff. Although this is a brief time series, if bond markets are viewed as overpriced and undesirable, it will fail to provide a traditional hedge to equity wreckage.
As the world reserve currency, the USD continues to act as the straw that stirs the financial asset drink. In September, the dollar measured by the DXY, reversed a 6-month downtrend by rising 2.2%, negatively affecting stock prices, credit, gold, silver, and other commodities. Since March, large dollar supply through monetary and fiscal stimulus depressed DXY by over 10%. One consequence of a weak dollar is that it contributes to inflation. However, inflation has been a threat since the Tech Wreck and the Great Financial Crisis because the government responded to these collapses by initiating large-scale stimulus through monetary printing. The thesis was that the increased supply of dollars would flood the economy and cause runaway inflation. However, the monetary stimulus mechanism is simply a route to add reserves to bank balance sheets. If the banks are reluctant to release those reserves to the economy through increased corporate or personal lending, the multiplier effect is unsuccessful. Once again, to counter the economic impact of the pandemic, the U.S. passed several stimulus packages, but banks are tightening lending standards, lowering credit limits and demanding higher minimum credit scores. As result, banks are applying a deflationary force that counteracts the government’s monetary efforts. However, the distinction with this regime’s rescue program is that banks are also being bypassed via direct payments to personal and corporate bank accounts. In August, the US Consumer Price Index (CPI) rose for the third consecutive month. The components that are leading the measure are Used Cars (up 5.4%!), Shelter, Recreation, and Household Furnishings.
Much of the dollar’s surge in September can be attributed to a logjam in Congress related to another round of stimulus spending. Negotiators remain far apart on an overall price tag, and with just over a month before Election Day, the window for striking a deal was slim. However, when an eventual deal is passed, the price tag will be north of $2 trillion, but less than the $3.4 trillion Democratic proposal in May. In any case, it should be sufficient to cap the upside on DXY, allowing for a renewal in commodities and stock prices.
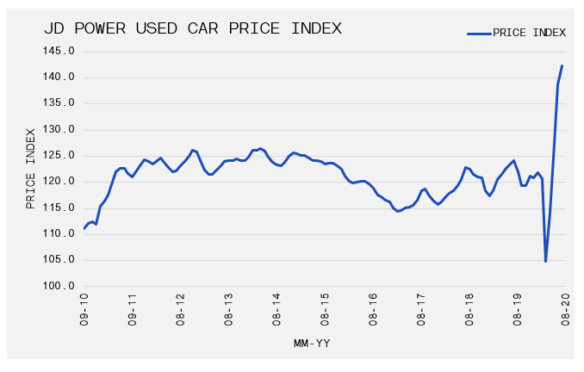
August 31, 2020
THE LUCRATIVE LORD STANLEY
Smart Money
There are several factors that make the 2020 Stanley Cup Playoffs exceptionally unique. One of those differences is the increased playoff bonus that has been set aside for the competitors. The NHL and NHLPA agreed to fund a $32-million pot for 2020, exactly double the amount offered during the 2019 playoffs. Click the link below to learn more about the playoff bonuses, the amount offe...
There are several factors that make the 2020 Stanley Cup Playoffs exceptionally unique. One of those differences is the increased playoff bonus that has been set aside for the competitors. The NHL and NHLPA agreed to fund a $32-million pot for 2020, exactly double the amount offered during the 2019 playoffs. Click the link below to learn more about the playoff bonuses, the amount offered to each team and the annual bonus projections through 2025-26.
August 25, 2020
Lumber and Stocks Extend Gains Through August
Market Recap & Boxscore
The summer of love for equity markets continued into August, led by the S&P 500 which rose 6.5% for the period, breaching its February all-time high. The TSX and MSCI World Indices also registered strong results, but to a lesser degree, rising 3.0% and 3.7%, respectively. In July, we identified the potential for a sector rotation away from Tech, but this did not materialize in Aug...
The summer of love for equity markets continued into August, led by the S&P 500 which rose 6.5% for the period, breaching its February all-time high. The TSX and MSCI World Indices also registered strong results, but to a lesser degree, rising 3.0% and 3.7%, respectively.
In July, we identified the potential for a sector rotation away from Tech, but this did not materialize in August. The US Tech sector rose 13.7%. It was once again the big companies leading the way, with Apple and Facebook up 31.9% and 20.3%, respectively. FB shook off concerns about reduced ad spending in their Q2 earnings report. Apple combined a strong Q2 with a 4:1 stock split, which gives retail investors the illusion that the stock is suddenly trading at a 75% discount. The logic that a pizza cut into four or five slices does not change the size or value of the pizza, seems to get lost when the pie is stock in Apple.
Interestingly, for much of 2020, Financials, Energy and Industrials withered while tech stocks bloomed. However, Energy was the only one who languished over the past four weeks. Consumer-related stocks have also surprised to the upside as the sector reported reasonably staunch Q2 earnings. For example, Foot Locker beat estimates as comparable store sales were up 18.6% in Q2, while a return to profitability helped to reinstate their dividend. More recently, Dick’s Sporting Goods similarly reported a 20.7% increase in same-store sales and reinstated their dividend. Both companies have benefitted from a rapid rise in online sales. Further, the ongoing rationalization of their store footprint, advanced in Q1, which helped boost margins and net income. It seems clear that despite record unemployment and a continued rise in defaults, the consumer remains strong due to fiscal support.
The sustained bid for commodities continued throughout August. Lumber lead the way, sporting a 46% leap during the period, adding to a cumulative 219% return since its 01-Apr-20 low. Elsewhere, the CRB Raw Industrials Index rose another 3.4% during the month and WTI oil ticked up 3.7%. While another 0.7% drop in the USD as measured by DXY continues to be a tailwind, the effects of capacity reductions across producers throughout their long-term bear market are also a factor. While many believe this is a short-term phenomenon with capacity expected to come back online quickly due to price strength, it is not that straightforward. Lumber capacity for example was hit from both the supply and demand side, and while demand has come back strongly from renovation and homebuilding activity, the supply side is more difficult to address. In Canada, producers have exhausted the excess supply of lumber caused by the Mountain Pine Beetle, and government restrictions have limited access to additional supply. Excess capacity south of the border will become accessible in response to record lumber prices. Nevertheless, these price level will have durability if demand remains strong.
In the precious metals space, silver accelerated another 7.9%, while gold prices paused (-0.7%) after a 10.3% surge in July. Even though softness in the US dollar and recovering commodities are promoting the inflation narrative, the 10-year US Treasury inched up 7bps. Yet, the 5 and 10-year US real yields fell 22bps and 11bps to -1.3% and -1.0%, respectively. We remain vigilant with respect to real yields, especially with yields near all-time lows and volatility awakening in the fixed income universe.
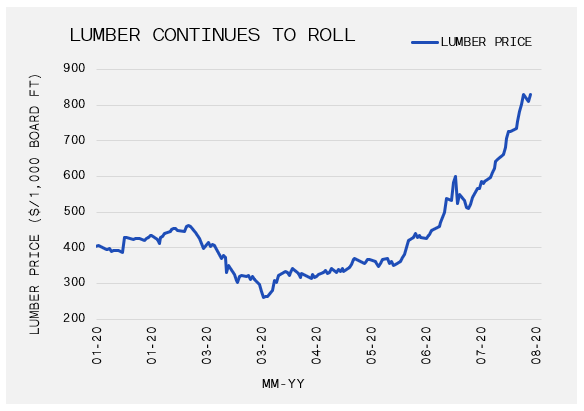
July 31, 2020
Staying On Track Of Your #Goals
Smart Money
On or off-the-ice, hockey players recognize that they need to surround themselves with the best teammates, trainers, sports doctors, etc. to achieve their full potential. Accordingly, we are encouraged that players are also partnering with advisors to accomplish long-term financial success. The next step in the progression for players is to make certain they are working with a special...
On or off-the-ice, hockey players recognize that they need to surround themselves with the best teammates, trainers, sports doctors, etc. to achieve their full potential. Accordingly, we are encouraged that players are also partnering with advisors to accomplish long-term financial success. The next step in the progression for players is to make certain they are working with a specialized advisor who is capable of executing the financial plan. To help the hockey community understand the services that should be offered in the context of a comprehensive financial program, the “I Have an Advisor” checklist provides a guide to ensure your advisor is keeping you on track.
July 27, 2020
Slumping Real Yields and the US Dollar Downturn Prop Gold Prices
Market Recap & Box Score
July marked another upbeat period for equity markets. The S&P 500 rose 3.1%, bringing its price increase since the March low to 44.2%. The TSX was boosted by sustained strength in commodities, which we discussed in our June recap. It climbed 3.3%. Meanwhile, the MSCI World Index returned 2.8%. The technology and health care sectors have provided the biggest lift since the benc...
July marked another upbeat period for equity markets. The S&P 500 rose 3.1%, bringing its price increase since the March low to 44.2%. The TSX was boosted by sustained strength in commodities, which we discussed in our June recap. It climbed 3.3%. Meanwhile, the MSCI World Index returned 2.8%. The technology and health care sectors have provided the biggest lift since the benchmarks touched bottom. However, Nasdaq did not shepherd the flock over the past several weeks. It is too early to declare that leadership is shifting. Nevertheless, scrutiny is intensifying, as the CEOs for the big four (Facebook, Amazon, Google, Apple) prepare to answer for their companies’ unproven anti-trust practices before Congress.
Perhaps the most interesting developments have been in the currency market, as the strength of the US Dollar (USD) has far reaching impacts. The greenback fell 4.2% as measured by DXY, which is a gauge of the USD relative to the currencies of its most significant trading partners. The decline brought the USD’s drop to a full 9.0% from the peak on 19-Mar-20. American policymakers continue to devalue its currency through unprecedented fiscal and monetary impulse. In late March, the government enacted the biggest intervention in the private sector since the Second World War to help fight the economic impact of coronavirus. Further, the Senate Republicans are finalising the details of their second rescue package this week. It is anticipated that trillions of dollars will be shoveled into infrastructure projects and into consumer wallets. On the monetary side, additional asset purchases will be required to pin yields lower across the curve. Foreign demand for Treasuries is uncertain; as such, the Federal Reserve will be needed to potentially mop-up the surplus. All of which will apply more pressure on the USD.
Related to the above, gold and silver’s upward momentum has continued unabated, casting a shadow over the shine in equities. Gold rose 10.2% to $1,940, a 34.5% year-to-date return, breaching its previous all-time high seen in 2011. While the move has been aggressive, the negative correlation between USD and Gold has intensified as the currency fades. Moreover, the price of gold has a primary relationship with real yields, which are simply nominal yields less the rate of inflation. Since gold does not generate a yield and thus has a cost to hold in the form of storage and insurance, traditionally US Treasuries have been a more attractive store of value. Even though global growth prospects continue to diminish, the falling USD causes commodity prices to advance which potentially translates into inflation. As a result, real yields have fallen to their lowest level seen since July 2012.
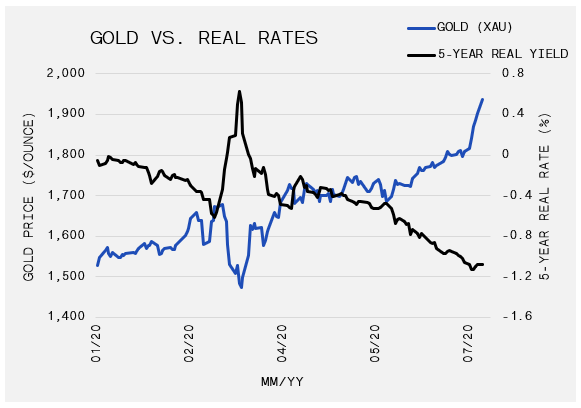
There is some certainty surrounding the growth aspect of the real rate equation. COVID-related shutdowns are reappearing, while data from unemployment claims, credit card spending, and air travel are plateauing in July. However, the inflation input is less conclusive. Following the Financial Crisis, many forecasters anticipated that government bailouts would produce price increases. Rather, Quantitative Easing was largely deflationary as the money injected into the financial system was generally retained by the financial sector. Although, inflation is more likely to boil over with fiscal policy expansion, higher minimum wages, de-globalization and oil prices that are no longer sliding.
Potentially related to USD weakness and commodities, but no less important, has been the relative strength of emerging market and European equities. In China, the Shanghai Composite Index rose 7.9% this month, while the MSCI European Index rose 4.3%. Both economies have been able to control the spread of Covid-19 much more successfully than the US, which seems to have attracted some fund flows. Add to this China’s announcement of paring back their stimulus efforts, which is in stark contrast to the US commentary above, and one can see the relative attractiveness.
July 17, 2020
GAVIN Equity Pool
Quarterly Update
Despite the modest movement, June was another volatile month for equities. What began as a rotation into more cyclical value stocks quickly turned into a dash for defensive and growth oriented securities as coronavirus cases in the United States accelerated. Our picks trailed the benchmark for a second straight month, finishing the quarter over 400 basis points behind the benchmark. T...
Despite the modest movement, June was another volatile month for equities. What began as a rotation into more cyclical value stocks quickly turned into a dash for defensive and growth oriented securities as coronavirus cases in the United States accelerated. Our picks trailed the benchmark for a second straight month, finishing the quarter over 400 basis points behind the benchmark. The general risk-on sentiment combined with a lower US dollar meant that momentum names reigned while select commodity and emerging markets advanced.
Click the link below to continue reading …
July 01, 2020
The Importance of Process
Second Quarter 2020 Newsletter
The Hammer and Dance – The second quarter of 2020 featured a sharp rebound in most asset classes following the steep decline in March. Most equity categories remain negative year-to-date. However, US technology stocks managed to push into new record territory. The dramatic recovery was supported by government programs and Federal Reserve actions which expanded the Fed balance sheet ab...
The Hammer and Dance – The second quarter of 2020 featured a sharp rebound in most asset classes following the steep decline in March. Most equity categories remain negative year-to-date. However, US technology stocks managed to push into new record territory. The dramatic recovery was supported by government programs and Federal Reserve actions which expanded the Fed balance sheet above $7 trillion by the end of the quarter. While market prices improved, the economy still faces a long road to recovery. Unemployment claims hit record levels while corporate earnings are expected to fall 20% year-over-year.
Commodities rallied strongly in Q2, clawing back some of the ground lost in Q1. This was helped by US dollar weakness and temporary oil production cuts from OPEC and Russia. Copper was a big gainer, rising nearly 22%, as the demand outlook improved while Coronavirus cases in South America ramped higher.
Government bond yields remained near all-time lows. Loose monetary policy, benign economic growth and the expectation for a continuation of “the Hammer and Dance” to contain COVID-19 pushed global rates lower.
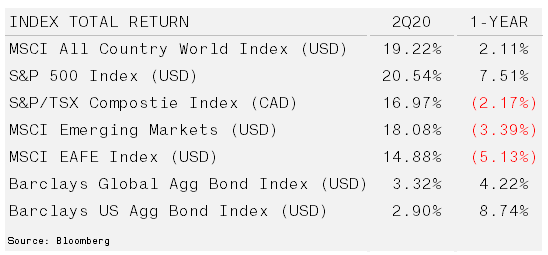
Proficiency with a Strong Foundation – It often seems that the best way to achieve a desired outcome is to focus exclusively on it. After all, results are much easier to measure and evaluate than a process. This approach however is far from optimal. Elite athletes gain proficiency at their craft by developing procedural memory – doing the same thing over and over. While this does not guarantee success, the probability of a favourable outcome improves through a disciplined process with many iterations.
Investing is a long-term process that has historically yielded the greatest rewards to those adhering to a consistent, disciplined, and replicable approach. This helps to remove the emotion involved in decision making that is often so detrimental when trying to generate a return. According to the 2010 Davis Advisor study , emotional interference has a sizeable impact on investment results. The study showed that while the average stock-based mutual fund returned 8.7% annually from 1994 to 2013, the average investor earned only 5% per year.
Think about the training process needed to achieve elite status in any field. It begins with building a solid foundation. For investing, an individual needs to have a good understanding of their current financial standing. Fair value assets should be greater than liabilities and sources of cash flows must exceed uses. This combination will allow for more capacity to invest and generally a higher risk tolerance which provides the prospects for higher returns.
Next, individuals should set clear financial goals. An investment plan is most effective when there is more detail about the individual characteristics, objectives and time frame. An investment portfolio should be constructed to achieve objectives with as little risk as possible. This allows investors to remain focused on meeting goals regardless of external factors such as job security or market conditions. The two primary decisions for portfolio design are asset allocation and investment selection.
Asset allocation determines the amount to assign across different investment classes defined broadly as equities, fixed income, real estate, commodities, and cash.
Investment selection is the step where securities that make up the asset class are chosen.
Once a framework is established, the final part of the investment process is implementation and monitoring. Establish best practices to ensure slippage is minimal. It is important to monitor both the financial position as well as the investment portfolio. No part of the process will be static. Being consistent and disciplined in evaluating and monitoring the process should not be confused with rigidity. It is important to be adaptable given an ever-changing financial position, opportunity set and market structure.
In summary, the investing process is more complex than simply buying a heavily promoted or popular stock or index. The short-term results can vary, but when assets are being managed for a lifetime, the process becomes increasingly important. The frequency of changes to external and internal factors necessitate a strong foundation. In the same way that a foundation provides confidence for an athlete to execute while outside forces wreak havoc; the portfolio process can protect the investor from destructive actions.
June 30, 2020
How NHL Players Spend Their Money
Smart Money
Our clients have listened to us preach for more than two decades that cash flow management is the cornerstone for financial independence. When savings targets are established, and a plan is in place to achieve those goals, the player and their family can confidently determine their spending priorities. In consideration of this, we analysed a sample of players to aggregate their outflo...
Our clients have listened to us preach for more than two decades that cash flow management is the cornerstone for financial independence. When savings targets are established, and a plan is in place to achieve those goals, the player and their family can confidently determine their spending priorities. In consideration of this, we analysed a sample of players to aggregate their outflows and identity how the average player spends their money. These findings are summarized in the exhibit and it may serve as a template or budget for current and future NHLers.
June 24, 2020
Low rates, yields and inflation keep fueling markets
Market Recap & Boxscore
While there has been some intra-month volatility, and some very interesting rumbles under the hood, the S&P 500 and TSX managed to accelerate 2.8% and 1.8%, respectively. However, European and emerging market strength combined with US dollar weakness helped the MSCI World Index race ahead by 3.9%. From a sector and style perspective, large cap growth and technology paced the Nas...
While there has been some intra-month volatility, and some very interesting rumbles under the hood, the S&P 500 and TSX managed to accelerate 2.8% and 1.8%, respectively. However, European and emerging market strength combined with US dollar weakness helped the MSCI World Index race ahead by 3.9%. From a sector and style perspective, large cap growth and technology paced the Nasdaq (+8%) as it sprinted past the 10,000 marker for the first time.
The lifestyle changes and the consumer response to the Covid crisis has intensified many of the long-term trends that were unfolding. Nevertheless, it is still astonishing to observe the degree to which valuations are being extended. For instance, it was noted that the combined market cap of Square, Shopify, Spotify, Zoom, and Tesla are now equal to that of Warren Buffet’s Berkshire Hathaway. To put this in perspective the combined trailing annual revenues for the five companies are equal to Berkshire’s normalized net income. For reference, Berkshire’s portfolio of companies include GEICO, Duracell, Dairy Queen, BNSF Railway, Fruit of the Loom, and significant minority holdings in Kraft Heinz Company and American Express.
As our readers and investors know, our priority is to safeguard capital. So, while stock markets are rallying, we are on alert for obstacles. First, rapidly rising Covid case counts in Texas, Arizona and Florida are worrisome. More recently, Germany and Japan have also recorded a spike in infections. Some are calling this the Second Wave, but the First Wave hardly abated. Optimistically, afflictions will diminish before the Fall’s traditional flu season otherwise investor sentiment will be rattled along with the fragile recovery. Further, US-China trade issues are a lingering disturbance.
Gold seems to have escaped its consolidation pattern. It flirted with $1,800 before ending the period at $1,792, rising 4.3%. The metal’s year-to-date return is now over 18%. Gold tends to outperform in periods of falling real yields. Accordingly, the strong case continues to develop due to economic uncertainty, hints of rising inflation, and depressed bond yields that are happily confined by the Fed.
Elsewhere in commodities, the chart below highlights the appreciation of lumber, copper, and oil since April. The trend is supported by a falling US dollar (USD), which peaked in March and dropped 3.1% this month. The potential for a shift to a persistently weak USD, though far from confirmed, would have significant influence on the deflation versus inflation narrative.
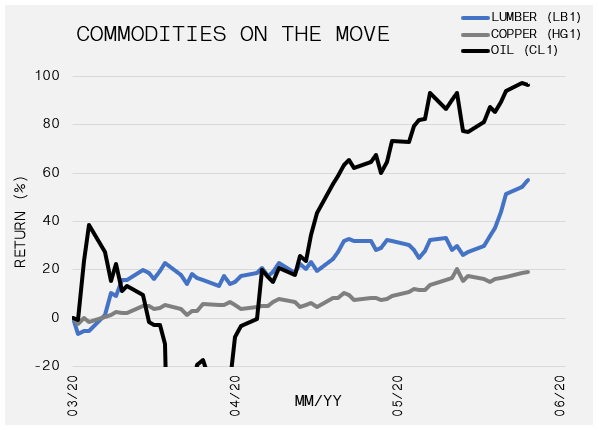
Support for the deflation scenario comes from an over-leveraged economy and the government intervention that is required to limit increases in yields and the costs to carry the ballooning debt. Meanwhile, the unprecedented monetary and fiscal stimulus could stoke sleepy embers of inflation. The extreme growth in US M2 is also inflationary. M2 is a gauge of money (cash, savings, money market instruments) in the US financial system. After growing 6% per year from March 2010 to March 2020, M2 soared 18% from March to June in 2020. Since 2008, monetary stimulus has caused inflation to show up in asset prices. Yet, with fiscal support invited to the party in 2020, the manifestation of consumer price inflation may become an economic reality that was absent over the past decade.
Oddly, long-term bond yields in the US are stubbornly low. The inflationary signals listed above have not been priced into 10-year yields. After briefly touching 0.91% in early June, the yield has reversed to 0.71% as of 24-Jun-20. The rate is still within the rising channel that began in April, but one key factor to consider is that The Federal Reserve has been buying Treasury Bonds to maintain low yields and a low borrowing rate. This has been exceptionally important because over the same period, foreign ownership of US Treasury holdings is declining. Without foreign buyers, The Federal Reserve’s motivation to intervene is heightened because it needs to support the economy and stabilize financial markets. But for how long can the Fed keep buying the debt issued by its parent, The Treasury? Interestingly, Ken Rogoff, Professor of Economics at Harvard University declared in March 2019, that this favourable condition will become flawed when fiscal policy is needed to “fight a financial crisis, respond to a large-scale natural disaster or pandemic, or mobilize for a physical conflict or cyberwar”. Perhaps, we are on the threshold of inflation becoming unhinged.
June 03, 2020
Returning to Play & COVID-19
Smart Money
Last week’s announcement that the NHL will return to play this summer was exciting in many respects, but it also created considerable uncertainty surrounding the safety of the players and their families. In a memo released by the NHL, players were informed that any athlete who contracted COVID-19 would have their “injury” categorized as hockey-related, unless it can be proven that a p...
Last week’s announcement that the NHL will return to play this summer was exciting in many respects, but it also created considerable uncertainty surrounding the safety of the players and their families. In a memo released by the NHL, players were informed that any athlete who contracted COVID-19 would have their “injury” categorized as hockey-related, unless it can be proven that a player contracted COVID-19 outside the course of his employment as a hockey player. However, these circumstances are unprecedented and, as a result, there are many outstanding issues. Accordingly, GAVIN created the attached exhibit to address many of the Frequently Asked Questions.
May 27, 2020
Stocks Deny The Hardship In The Economy
Market Recap & Box Score
We will describe the disorder of investing in 2020 before disclosing the market return data during the past month. First, on 21-May-20, another 2.4 million US citizens filed for unemployment in the previous week, bringing the total to nearly 39 million. An additional 1.1 million Americans sought jobless claims under a new ‘temporary Pandemic Unemployment Assistance Program’ so headli...
We will describe the disorder of investing in 2020 before disclosing the market return data during the past month.
First, on 21-May-20, another 2.4 million US citizens filed for unemployment in the previous week, bringing the total to nearly 39 million. An additional 1.1 million Americans sought jobless claims under a new ‘temporary Pandemic Unemployment Assistance Program’ so headline numbers are in fact understated.
Next, tensions with China continue to mount. Evidently, this rivalry will become Trump’s primary focus ahead of November’s election. China’s handling of Covid-19 and the embattled trade deal are persistent aggravations for the enigmatic President. Additionally, China’s new national security bill that increases surveillance in Hong Kong has implications for the US. Hong Kong needs to retain enough autonomy to qualify for US tariff exemptions that are otherwise imposed on China. Also, in Asia, military skirmishes along the China-India border have been reported throughout May. Peace has largely existed between the two countries since their war in 1962. However, scuffles frequently erupt along the 3,488 km frontier that is generally disputed and indistinguishable.
How have these severe disturbances impacted equities? Well, a continuation of the rally, of course! Whether it is the US (+2.8%), Canada (+2.5%), or the MSCI Ex. US (+2.9%), global markets continue to grind higher and force bear after bear to hibernate. There are several reasons to justify a continuation of the bounce off the March low, including the cap-weighted nature of the S&P 500, whereby the largest constituents (ie. Microsoft, Apple, Amazon, Facebook) account for a disproportionate weight in the index’s price and underlying earnings. Tech, Healthcare, and Communications represent almost 50% of earnings for the index. These sectors are understandably less affected by the pandemic relative to the median US company. However, price action later in the month began to shift with sectors such as Financials, Industrials, Real Estate and Materials taking the lead while Tech and Healthcare lagged. Surely if the economy’s reopening is as smooth as the market’s rebound suggests, this trend will likely continue. Moreover, the potential for rapid and vibrant economic growth when the economy is fully reopened is conceivable given it is bolstered by trillions in Federal and monetary stimulus. Nevertheless, with so much economic uncertainty, the threat of a second wave of the virus and the S&P 500 hovering around key technical resistance points, we are focused on right-sizing exposures and ensuring adequate protection.
We regularly evaluate the bond market for insight on future cross asset movements. In May, longer-term US yields exhibited an upward trend. The corresponding chart (inspired by Jawad Mian of stray-reflections.com) maps the big decline in bond yields since the beginning of the secular downturn in rates from 1981. The shaded areas indicate each instance where the 10-year yield retraced 61.8% of its drop during the preceding 2 to 14-month period.
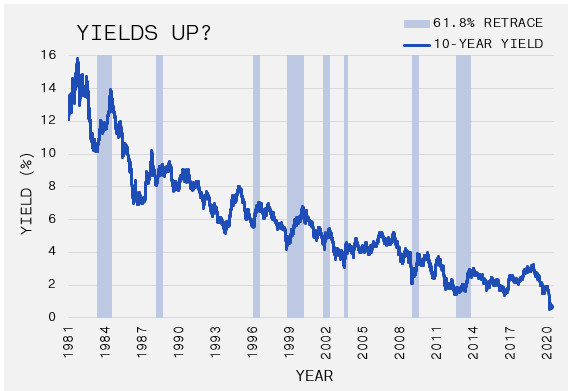
Today, the 10-year has fallen from a high of 3.2% to a low of 0.4% in March, which would pin a 61.8% retrace at 2.1%, with the midpoint date in 6-9 months.
If this forecast materializes as the model implies, whether it is prompted by real economic growth or a return of secular inflation, the knock-on effects may be considerable. It could reverse the duration trade that has supported equity markets throughout the bond yield’s historical descent; and, particularly, the fast growth-low profit stocks. Fears of higher rates would also impact the perceived credit quality of the US, whose debt position will swell due to the $4 trillion deficit in 2020. Rising rates will also affect the ability of corporations to service an unsustainable debt position, which has expanded by $834 billion through the end of April. Finally, percolating inflation may jolt commodity markets which have been fighting to get out of the dumpster for years.
This outcome is speculative at best, but the ingredients are certainly present for the scenario to play out. Further, the set-up is reinforced by massive monetary and fiscal stimulus, de-globalization, emerging cold war with China, onshoring of US jobs and the initiation of “just-in-case” inventory management. We will continue to be vigilant and active when evaluating the prospects for inflation (and deflation) to structure portfolios that protect and benefit in different environments.
May 01, 2020
Tips for the Successful Investor
Smart Money
There are certain unique factors involved in managing the finances of NHL athletes. Items such as experience, time horizon and liquidity make the investment portfolio of an NHL athlete much different than the average long-term investor. However, discipline and commitment are characteristics that must be shared by all successful investors. Click the link below as GAVIN has itemized fiv...
There are certain unique factors involved in managing the finances of NHL athletes. Items such as experience, time horizon and liquidity make the investment portfolio of an NHL athlete much different than the average long-term investor. However, discipline and commitment are characteristics that must be shared by all successful investors. Click the link below as GAVIN has itemized five important reminders for implementing a successful investment strategy.
April 28, 2020
Oil Prices Become Negative As Stock Markets Rebound
Market Recap & Box Score
After the S&P 500 and MSCI World indices fell 33.5% and 27.3%, respectively from the 20-Feb-20 high to 23-Mar-20, markets globally have shrugged off any negative economic news, leading to rallies of 27% and 24%, respectively. Since our last note 26-Mar-20, the S&P 500, MSCI World and TSX indices are up 14.8%, 11.5% and 9.6%, respectively. As an endorsement to the dichotomy b...
After the S&P 500 and MSCI World indices fell 33.5% and 27.3%, respectively from the 20-Feb-20 high to 23-Mar-20, markets globally have shrugged off any negative economic news, leading to rallies of 27% and 24%, respectively. Since our last note 26-Mar-20, the S&P 500, MSCI World and TSX indices are up 14.8%, 11.5% and 9.6%, respectively.
As an endorsement to the dichotomy between the economy and the stock market, consider that one of President Trump’s economic advisors optimistically estimated that US GDP would fall 20-30% in the second quarter, and unemployment would hit 16-17%. Yet, the broad market is off only 15% from its all-time highs, despite 26 million job losses in the US. During the Great Financial Crisis of 2007-08, the US lost 8.7 million jobs, unemployment peaked at 10.2%, GDP feel 4.3% and the S&P500’s peak-to-trough decline was 56.4%. Notably, the prompt and substantial rescue efforts supplied by the Fed and Congress should shorten the duration of the hardship this time around. And, with any luck, produce a ‘V-shaped’ economic recovery.
Commodities have been an incredibly interesting space, with many revealing conflicting stories and one product making unprecedented moves during April. Oil, as measured by the WTI May contract, fell to -$37 per barrel on 20-Apr-20, meaning an owner of a barrel of oil would pay a counterparty to take it off their hands. Granted, volume was very low at this price point and with the expiry of the May contract just two days following, any actual economic activity shifted to the following month. However, anyone stopping their analysis there are doing themselves a disservice as the historical event is significant for at least a couple of reasons.
The primary cause is related to a lack of storage capacity for oil, which again is a function of demand falling off a cliff. If you are a trader and cannot sell your oil contract or find someone to store it for you, you must take delivery of WTI at Cushing, Oklahoma. Since many speculators are unable to accept delivery, and severe storage shortages exist for those willing, desperation created negative prices.
The downside of commodity financialization also contributed to the pricing dysfunction. ETFs own a large percentage of the paper contracts for these products. In particular, US Oil Fund (NYSE: USO) owned 25% of the May futures contract. However, an ETF can not legally take delivery of the physical commodity. Therefore, the ETF is required to roll, or simultaneously sell one month and purchase the following month in an equal amount. This creates a natural downward push on the price of oil in any given month, and given the supply/demand imbalance in May, the prices collapsed. So far, we are seeing a similar situation unfold for the June contract. The price is down 23% as of 27-Apr-20.
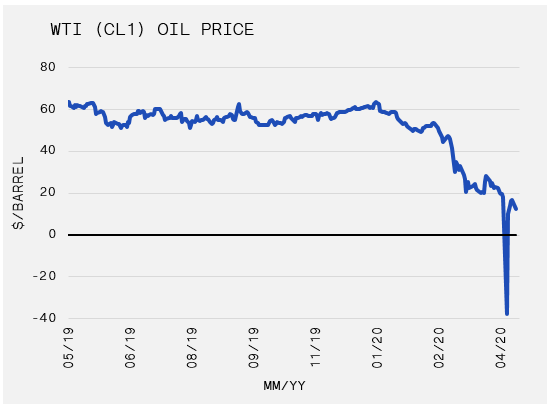
While oil continues to fall, copper, a key industrial commodity and historically a great predictor of economic conditions, has demonstrated sustained strength through April, up 5.1% during the month. Copper began its sharp fall in late January, which reflected the economic situation and demand destruction in China. Its low was hit the same day that equities bottomed on 23-Mar-20, but the April rebound could hint at further gains. Also, noteworthy is the performance of gold, which has continued to move higher after falling with stocks in March. Gold is up 6% in April, hitting highs not seen since 2016, and is now 47% above its 2018 low. With global monetary and fiscal stimulus surprising even the most dovish of analysts and yields falling, the stage is set for a sustained bull market in the metal. Nevertheless, the trade is incredibly crowded, and the certainty of the predictions gives cause for concern.
We have written at length about credit in the past and to keep on top of the situation, it appears that US high yield credit spreads have once again begun to widen, albeit on a short time frame from 16-Apr-20. Originally, the spread over Treasuries peaked at of 10.9% on 23-Mar-20. But the support offered by the Fed and Congress, followed by the surprise proclamation of direct purchases of investment grade and downgraded high yield debt, caused yields to contract to a low of 7.35% on 13-Apr-20. Both investment grade and high yield issuers have been on a debt issuance binge since these announcements were made, taking advantage of the opportunity to either refinance existing debt or extend the maturities while the credit window was open. Outside of a few failures, a large-scale default cycle has yet to materialise, even within the oil patch. We will be monitoring spread behaviour closely as a re-widening of spreads with such large-scale Fed and Government support would be a red flag.
April 01, 2020
Maintaining Balance When Gains Fade Away
First Quarter 2020 Newsletter
COVID-19 – The first quarter of 2020 will forever be synonymous with COVID-19. The rapid spread of this strain of coronavirus coincided with a swift decline in major asset classes as economies around the globe were forced to shutdown. The S&P 500, for example, registered its worst quarterly return since Q4 2008, entering its first bear market in over 10-years. Commodity prices, ot...
COVID-19 – The first quarter of 2020 will forever be synonymous with COVID-19. The rapid spread of this strain of coronavirus coincided with a swift decline in major asset classes as economies around the globe were forced to shutdown. The S&P 500, for example, registered its worst quarterly return since Q4 2008, entering its first bear market in over 10-years.
Commodity prices, other than gold, fell sharply over the quarter. On top of a demand shock, oil was crippled when a price war erupted between OPEC and Russia. The price crumbled by more than 60%. The Canadian dollar declined against the US greenback by over 8%. Meanwhile gold prices rose 3.7% in US dollar terms. Government bonds provided some protection during the equity and commodity rout, as central banks cut interest rates and restarted quantitative easing.
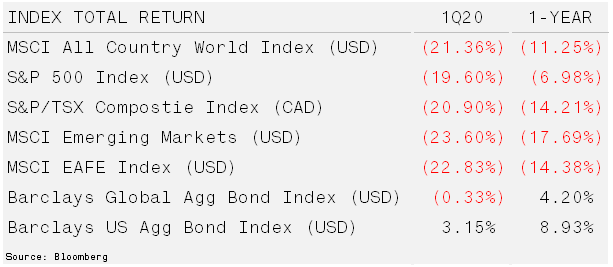
The Non-linearity Of Market Returns – The old adage to “not let your highs get too high and lows get too low” is often cited by coaches to remind athletes about maintaining a balance. Over confidence often leads to poor habits while the psychological impacts of losing hope can become self-fulfilling. Whether it is sports, diets or investing, results are maximized when interests are aligned and participants abide by a precise process.
When analyzing US equity returns over the past two decades, it is easy to see how opinions about markets are formed based on individual experiences. Investors who began investing on 31-Mar-00 have a 20-year annualized return of just 4.9%. This is less than half the long-term average and the results achieved by an investor who started on 31-Mar-10. Furthermore, the investor from the March 2000 experienced two routs that caused their life savings to be cut in half twice within the first ten years of investing. Meanwhile, the latter experienced only one drawdown greater than 20%, and this occurred after compounding capital for over 9-years at 13.1% annually.
Looking back at market history, this type of return profile is far from unique. Gains over the average investment lifespan tend to cluster, in non-linear fashions. Even the strong periods face uncertain timing. For example, the more fortunate 2010 investor’s average annual return would drop from 10.2% to 6.4% if they missed the five best trading days. Five days astoundingly accounts for less than 2% of the trading days over a ten-year period.
Adding further mental strain is the period when the most pronounced gains occurred. The three worst bear markets, defined as a 20% decline, include the 1929 Great Depression, the 1972 decline which involved the Watergate scandal and Vietnam War and the more recent 2008 Global Financial Crisis. As bull markets often follow bear markets investors who sold at the bottom of these markets faced significant long-term impairments to their capital. While bull markets often last for years, a significant portion of the gains typically accrue during the early months of a rally.
Despite facing 10 drawdowns of 30%+ over the past 150 years, US equity markets have compounded capital at over 10% per annum. Throughout this period the investors made it through two world wars, a cold war, rampant inflation, extensive conflicts in the Middle East and terrorist attacks, among others. All this suggests non-linear returns tend to be the norm more often than the exception.
In today’s context, investors who have become discouraged because three years of gains were wiped out in one quarter, should not risk harming long-term returns by making short-sighted, emotional decisions. Certainly, these events can be frightening, but history shows that risk is rewarded for those who stay committed to the equity market for the long run. This is perhaps truer today than in the past, as just 5 stocks account for over 20% of the S&P 500. This is the highest level of concentration in its history. Accordingly, opportunities are becoming plentiful.
March 31, 2020
Taking Care of Business
Smart Money
The emergence of COVID-19 has changed our lives in multiple ways. As we navigate through the crisis, we are working differently but still helping our clients understand the financial implications of the disruption and encouraging our players to stay productive during the shutdown. We hope this video helps you stay informed and entertained.
March 26, 2020
Just when you thought it was safe to go back in the water
Market Recap & Box Score
Despite providing our last market update just ten days ago, we wanted to offer a recap of the events as governments have implemented measures to protect the economy and maintain order in the financial markets. Here is the good news … on 25-Mar-20 the US announced a $2.2 trillion fiscal stimulus package, helping citizens through direct payments and unemployment benefits, while also sup...
Despite providing our last market update just ten days ago, we wanted to offer a recap of the events as governments have implemented measures to protect the economy and maintain order in the financial markets.
Here is the good news … on 25-Mar-20 the US announced a $2.2 trillion fiscal stimulus package, helping citizens through direct payments and unemployment benefits, while also supporting small and large businesses through access to credit. These measures were delivered after the Fed cut rates to zero and announced a $700 billion quantitative easing program. To help ease corporate funding, the Fed restarted its commercial paper funding facility, indirectly purchasing short-term obligations to lower funding costs. In addition, the Fed announced a plan to increase Treasury purchases, and more importantly, expand their planned products to corporate bonds and the ETFs that hold investment grade issues. So far it seems that the market has appreciated the efforts.
From its bottom on 23-Mar-20, the S&P 500 has appreciated 20%. Accordingly, March 2020 has produced both a bear market and bull market! The TSX rose 19.5% from its low. Despite this strength, the S&P 500 and TSX are down 19.3% and 21.6% year-to-date.
Rates have been equally entertaining. The 10-year US Treasury Yield fell from 1.91% on 31-Dec-19 to 0.50% on 09-Mar-20. The sinking long-dated rate reflects the slowing economy. The significance of the deceleration is amplified when one considers that the yield was 3.20% in November 2018. At the time of writing this brief, the yield rebounded to 0.74%.
The flow of investment capital has been a significant contributor to the market volatility. Many large players like relative value strategies, hedge funds, and commodity trading advisors (CTAs) reduced their exorbitant leverage and/or moved from a net long to a net short bias. This indiscriminate selling to lower their exposure and leverage impacted the benchmarks to the downside. It seemed like most of this forced selling was complete late last week. But then another large player entered the mix. The end of March is rebalancing season for pension plans. US pensions maintain an equity bias due to their overly aggressive 7%+ return targets. This means that after a 25-30% selloff in equities, they must purchase more stocks to bring that content back to a prescribed level. Accordingly, pensions need to sell Treasury Bonds to finance the stock purchases. Goldman Sachs estimates that this quarter will be the largest dollar value of pension assets moving into equities on record (second to Dec-18), requiring $280 billion of purchases during the final week of the month.
Covid-19 is still in its relative infancy in North America. Trump’s “Back-to-Work-by-Easter” pledge may put some at ease as it relates to the short-term economic impact of the virus. However, we fear that the human and healthcare toll will be dreadful if this promise is fulfilled. It still does not seem that the US population is taking the threat seriously, especially given the country’s high incidence of diabetes, obesity and hypertension, relative to the Asian nations that were originally exposed to the virus. In addition, the US just reported that an astonishing 3,300,000 workers filed for unemployment last week, a number that was more than twice as high as consensus estimates. If Covid-19 infections accelerate exponentially, unemployment will swell, consumer spending will grind, and business activity will stall further. A potential corporate default cycle could ensue which would render the prospect of a V-shaped recovery a fantasy.
There are two primary factors that have influence over our willingness to increase growth assets materially in our portfolios: a sustained recovery in credit and a fall in volatility.
Often credit leads the way in a recovery. In the embedded chart, yields (represented by the black line) begin to fall late in 2008, a full four months before equities. The S&P bottomed after a further 24% slide. Currently high yield spreads, as measured by ICE BofAML US High Yield, are 10.11%, up 6.45% from the February low. This level has not been seen since June 2009.
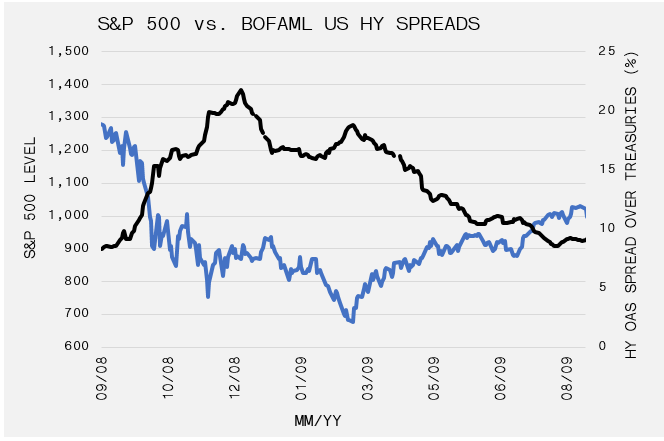
Volatility, as measured by VIX, remains above 60, which implies that there is no end in sight for these large market swings. Humans are loss-minimizing creatures by nature, meaning the pain experienced by a loss far-exceeds that of a gain. Therefore, a continuation of high volatility suggests that uninterrupted equity market gains are not imminent. We would prefer to see both yields and volatility come down in a sustained manner before believing the three-day rebound is anything more than a bear market rally which are prevalent across almost all historical selloffs.
March 16, 2020
Frightened Investors Trigger Sell Off Due to Coronavirus Pandemic
Market Recap & Box Score
In less than one month, the S&P 500 gave back almost the entire 43.7% return it achieved since the low on Christmas Eve 2018; and, it revisited levels not seen since Feb-17. Since our last update on 20-Feb-20, the S&P 500, TSX, and MSCI Indices are down 29.3%, 31.1% and 29.8% (as at 16-Mar-20). While the sheer degree of the pullback is newsworthy, the volatility and velocity ...
In less than one month, the S&P 500 gave back almost the entire 43.7% return it achieved since the low on Christmas Eve 2018; and, it revisited levels not seen since Feb-17. Since our last update on 20-Feb-20, the S&P 500, TSX, and MSCI Indices are down 29.3%, 31.1% and 29.8% (as at 16-Mar-20).
While the sheer degree of the pullback is newsworthy, the volatility and velocity of the move is really astounding. In fact, the 12% drop on 16-Mar-20 marked the first time since the Great Depression that investors have seen either 6 consecutive days of 4%+ moves, or 3 consecutive days of 9%+ moves in the S&P 500. The blowout in volatility has not been confined to equity markets either, as it has crept into gold and oil, among others. Speaking of oil, it has experienced its own fair share of problems in March. Russia refused to comply with a planned production cut to help alleviate the demand disruption caused by Covid-19. In response, Saudi Arabia showed once again who truly runs the table at OPEC, announcing they would increase supply to record volumes, over 12MM barrels per day, beginning in April. With this and planned increases from Russia, UAE, Iraq and Nigeria, the supply glut has pushed the price of WTI down 45.2%. This will surely add strain to an already weak US Shale sector, further adding stress to weak corporate balance sheets.
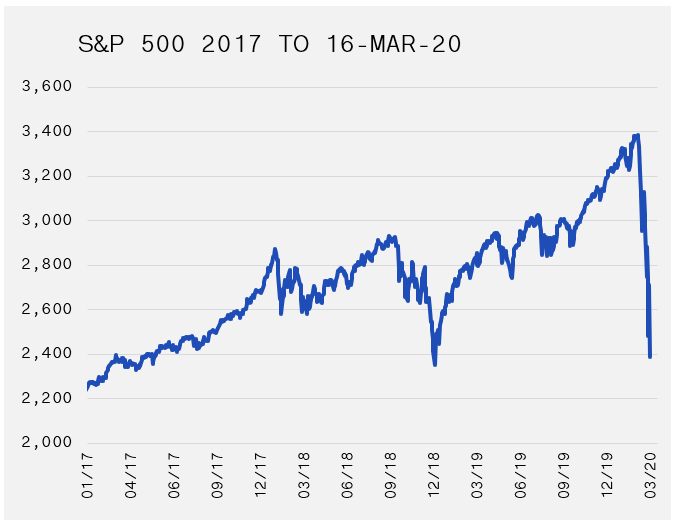
In 2019, many investors became increasingly convinced that stock markets only move in the “up” direction. They found themselves chasing a market that was running away like it stole something. Today, these same investors are complaining that the pullback, spurred by Covid-19, is a Black Swan that nobody could have foreseen. While foreseeing a global pandemic is difficult, Coronavirus has been newsworthy since December and it was highlighted in our newsletters since January. Irrespective of the predictability of the virus’s impact on capital markets, the economic slowdown was evident before the respiratory illness was distinguished from a Sunday morning reaction to a Corona overindulgence.
It was plainly obvious that leverage in the corporate system was becoming a potential red herring. A rising stock market was diverting cash flows to stock buybacks rather than strengthening the balance sheet, optimizing the supply chain, or investing in PP&E. Further, the popularity of just-in-time inventory management to better streamline working capital caused corporations to become more fragile to any interruption in sourcing and maintaining adequate inventory. Does this mean that these aforementioned points were enough to spur a 30% equity rout? No, but it indicates that corporations and the global economy were uniquely sensitive to anything that could disturb the status quo. Introduce a novel virus … which is uniquely contagious in its underlying ability to be spread by asymptomatic or mildly infected persons, but severe enough to hospitalize between 10-20% of the afflicted… and, you have a perfect storm for the healthcare system, credit markets, the economy, and small and medium businesses and their owners/employees.
Is this to suggest that GAVIN anticipated where the puck was going and was short equities/long duration beginning on 20-Feb-20? We wish! However, we have been managing our clients’ assets with prominence for downside protection. Considering the economic factors discussed above, we maintained exposure to ‘risk assets’ (ie. individual stocks and long-only funds) to approximately 40-50% depending on our long-term investors’ risk tolerance. Moreover, we were consistently increasing exposure to Alternative Assets, excluding private equity, as economic perils mounted. In addition, we know each clients’ cash needs for any given 6-month period and ensure that there is always adequate liquidity in the form of cash or short-term instruments to cover these obligations. This has allowed us to minimize our downside participation in chaotic times; and, equally important, we can monetize and reallocate to risk assets when we feel the discounts are sufficient to allow for a proper margin of safety. This does not imply that we will time the bottom, far from it, but we have the flexibility to average into positions in great companies that we are comfortable holding through and post Covid-19.
It was difficult to field questions in 2019 about the absence of 30%+ returns in our client portfolios. Further, our apprehension with valuations and the sustainability of the bull market caused us to miss out on new clients who were reluctant to part with their 100% equity allocation. However, we are in the business of preserving wealth; as such, during turbulence we can demonstrate the benefit of investing through a full market and the value of active management. It is now on us to continue to stay vigilant, and to effectively transition from the defensive zone through the neutral zone and into the offensive zone.
March 07, 2020
A League of Their Own
Smart Money
It’s been more than 20 years since women’s hockey joined the Olympics in Nagano, however the past decade has undoubtedly seen the sport take its greatest strides. From the emergence of the professional leagues, to the talent development outside of North America, the past 10 years has seen the women push the sport to new levels. As the sport continues to fight to “close the gap”, GAVIN...
It’s been more than 20 years since women’s hockey joined the Olympics in Nagano, however the past decade has undoubtedly seen the sport take its greatest strides. From the emergence of the professional leagues, to the talent development outside of North America, the past 10 years has seen the women push the sport to new levels. As the sport continues to fight to “close the gap”, GAVIN has identified seven women across different areas of hockey, all working hard to make a meaningful impact on the sport.
February 28, 2020
Coronavirus & Your Portfolio: Headlines May Misguide You
Smart Money
This week has provided ample ammunition for click-bait headlines. News of the coronavirus spreading has been the catalyst for an overdue correction in equity markets. In times like these, it is important to remember a number of truisms that are employed by successful, long-term investors. The first is that corrections (defined as a 10% decline) and/or bear markets (defined as at leas...
This week has provided ample ammunition for click-bait headlines. News of the coronavirus spreading has been the catalyst for an overdue correction in equity markets. In times like these, it is important to remember a number of truisms that are employed by successful, long-term investors. The first is that corrections (defined as a 10% decline) and/or bear markets (defined as at least a 20% decline) are normal occurrences in equity markets. In fact, corrections occur on average every 12-18 months and should be considered a great time to add to your best ideas. The second is that there is always a reason to sell. In fact, the imbedded chart shows that over the past 10-years there were numerous corrections and triggers. Nevertheless, the market climbed over 400%. As Warren Buffett famously stated: “Buy when others are fearful and sell when others are greedy”. All the same, we recognize investors become increasing concerned about the greatest risk of all, a permanent loss of capital. As such, we combat these risks in multiple ways:
Multi-asset class portfolios. This means that only a portion of your capital is exposed to these large swings. For example, bonds (and cash) can not only help protect money in a bear market, their stability also provides an option to take advantage of stock discounts. If a car you wanted to buy was all of the sudden 15% off, would you be more or less likely to purchase?
Low correlation investments. Your assets include securities that may be a drag on returns when the equity markets are surging but act as a source of relative return when stocks decline. This may include farmland, gold or hedged strategies; investments that can make money regardless of the equity market’s direction.
Undervalued Companies. We avoid “story-stocks” or over-hyped securities. An example is a business that we previously owned, Mastercard. This is a great company operating in a dynamic sector with terrific competitive advantages – it is essentially a toll road for electronic payments. However, at over $300 per share, the price implied that it would take 20-years to recover your capital at the rate the company earns a profit. Further, most of the top company’s today (Facebook, Amazon, Google) barely existed 20-years ago. More significantly, one of the most loved companies of the late 1990s, General Electric, is down 55% over that period.
We have seen the economic picture shifting dramatically since the end of 2018, with signals of a U.S. recession on the horizon combined with excessive behavior in some areas of the market. As a result, only 40%-50% of your capital is exposed to equities, we have plenty of “dry-powder” to deploy when better buying opportunities arise. This does not mean we will be unscathed, rather we are in a good position to make rational decisions. It is not about timing the market. We employ a studious and continuous risk management process that corresponds to your investor characteristics.
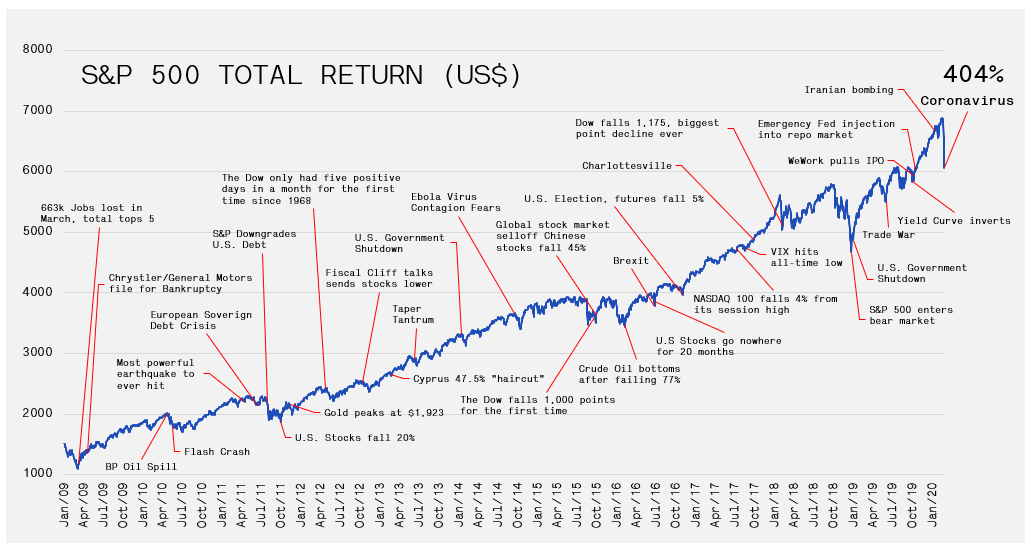
February 26, 2020
Coronavirus Fears Sweep Through Markets
Market Recap & Box Score
With three trading days left in February, it looks like we will see our first monthly decline across global equity markets since August 2019. As we entered February, the New Year began just as 2019 ended. Confidence surged as macro-headwinds were easing, manufacturing data appeared to be stabilizing, and most importantly, the dynamic duo of the US Fed and Trump would be able to keep...
With three trading days left in February, it looks like we will see our first monthly decline across global equity markets since August 2019. As we entered February, the New Year began just as 2019 ended. Confidence surged as macro-headwinds were easing, manufacturing data appeared to be stabilizing, and most importantly, the dynamic duo of the US Fed and Trump would be able to keep markets levitated at least until the election. Then a potential black swan in the form of the Chinese novel coronavirus crashed the party, spooking markets and sending the S&P 500 and MSCI indices down 5.6% and 5.9%, respectively. The TSX has fared better as a 5.6% rise in the value of gold has helped temper the fall.
Before Chinese New Year, markets became doubtful that the government could contain the outbreak. Nevertheless, official reports from China gave the impression that restrictions on the movement of about 50 million people were limiting the spread of the virus. Unfortunately, the international case count delivered on 20-Feb-20 disclosed that the spillover was accelerating. By 25-Feb-20, the number of daily new COVID-19 cases outside China exceeded those inside the country for the first time, according to the World Health Organization.
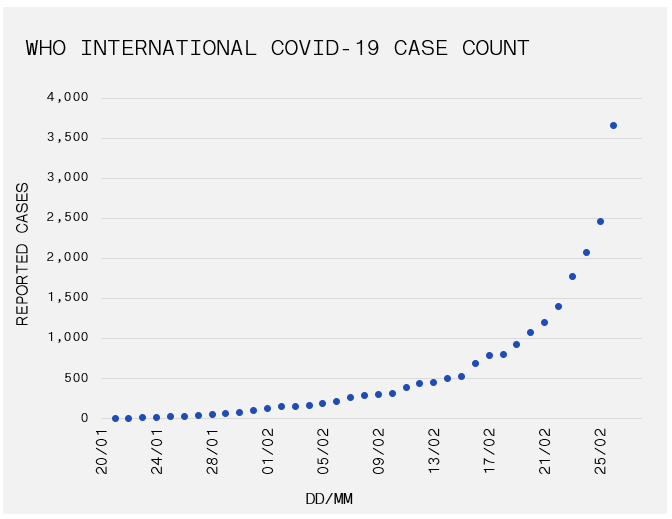
Whether or not the human implications will be as large as some are forecasting is up for debate. Nevertheless, less debatable is the economic implications that have and will come about as supply chains continue to be disrupted. Corporations grind to a halt as their workers undergo quarantine and are correspondingly forced to lower their guidance. Apple was the first market darling to announce revisions on 17-Feb-20. Mastercard lowered its outlook on 24-Feb-20, and its stock price promptly responded with an 11.3% correction. This will surely not be the last corporation to hint at the virus’s impact, and both the severity and duration of the virus’s spread will continue to drive the market in the coming weeks and months. The combination of worries has offset a fairly strong Q4 earnings season. Investor focus will shift forward to discount the potential implications of a sustained global loss of demand, and the subsequent impact on an over-levered and under-prepared corporate sector.
Certainly, equities have taken their lumps, but commodities (ex. Gold) are absorbing the full impact of the fear trade. CRB Commodities Index is down 9.7%. Oil has led the decline with WTI and Brent crude falling 15.3% and 16.0%, respectively. The demand destruction from the world’s second largest economy, and potentially globally, has crushed crude prices and energy stocks. Copper similarly experienced a 9.3% drop; although, interestingly it has stabilized since 31-Jan-20.
Meanwhile, bond yields are being bid to record lows as money flocks to fixed income during the coronavirus scare. Fundamentally the move makes sense. As growth and inflation expectations moderate, bonds become more desirable. Nevertheless, quick and substantial action on behalf of central banks is being initiated to soften the economic impacts of the virus. The Chinese government has already begun to pump monetary and fiscal stimulus, announcing over C$300 billion for special re-lending funds to companies who are reporting 50-60% operating capacity. Hong Kong announced a $15.4Bn package which included a HK$10,000 (~C$ 1,700) payment to every permanent resident 18 and older. Treasuries seem to be forecasting a similar reaction from the US Federal Reserve to help stem any loss of economic strength. It remains to be seen if these activities will help the economy bounce back, but JPMorgan Chase prophesised that China would grow 15% in 2Q19 on a quarter-on-quarter, annualized basis.
Interestingly, on the surface, the Chinese market has not looked back since 01-Feb-20 with the Shanghai Composite Index rising 10.2% month-to-date, essentially wiping out prior weakness. In addition, many areas previously on lock-down have restrictions lifted over the past week as Chinese authorities shift from total quarantine to monitored surveillance. Again, it is difficult to determine whether this is the result of a genuine health improvement or economic desperation … only time will tell.
January 29, 2020
Resolutions for NHL Athletes
Smart Money
The annual New Year’s resolution tradition motivates millions of people to make changes in their life. The enduring success of those commitments is often dubious. Nevertheless, the exercise helps set the path for progress. In the diagram that follows, we have identified the top 10 most common resolutions and assigned the financial equivalent for professional athletes. Best wishes for ...
The annual New Year’s resolution tradition motivates millions of people to make changes in their life. The enduring success of those commitments is often dubious. Nevertheless, the exercise helps set the path for progress. In the diagram that follows, we have identified the top 10 most common resolutions and assigned the financial equivalent for professional athletes. Best wishes for a successful 2020 – on and off the ice!
January 21, 2020
A Hectic Start to the New Year, Except in Stocks
Market Recap & Box Score
With the first 20 days of 2020 in the books, global markets have continued their 2019 ascent with the S&P 500, TSX and MSCI World indices rising 4.4%, 3.3% and 3.5%, respectively. While we had cited a lack of retail and institutional participation as a reason for optimism in 4Q19, it seems that narrative has flipped as we enter the early innings of 2020. According to the CNN Fea...
With the first 20 days of 2020 in the books, global markets have continued their 2019 ascent with the S&P 500, TSX and MSCI World indices rising 4.4%, 3.3% and 3.5%, respectively. While we had cited a lack of retail and institutional participation as a reason for optimism in 4Q19, it seems that narrative has flipped as we enter the early innings of 2020. According to the CNN Fear & Greed Index, a 7-indicator reading of investor sentiment, the 21-Jan-20 reading hit 86 out of 100. This is a remarkable rise from the 30-range in September 2019. Moreover, it indicates extreme greed and a high level of complacency. Interestingly, gold has maintained its upward momentum, rising 5.1% for the month. Equity markets are broadcasting a calm signal, but gold’s shine reflects political turmoil in the middle east and the expectation for falling real rates, which boosts demand for the metal. Fears of reflation could be suppressing expectations for real yields in the future which is typically the true influence on the price of gold.
Elsewhere in metals, the meteoric rise in the price of palladium has been attention-grabbing. Palladium is a key component of catalytic converters. Eighty-five percent of mined palladium is used to turn toxic pollutants to carbon dioxide and water in exhaust systems. As governments like China clamp down on vehicle pollution, automakers have increased its usage. Coincidently, consumers are moving from diesel-powered cars which utilize platinum to carry out the same operation, to gasoline which uses palladium. As demand has increased, the supply has flatlined as palladium is primary mined as a by-product of platinum and nickel mining, rather than a focused end product. As automakers scramble to secure inventory, the price of palladium has risen 22.5% in Jan-20, which comes off of an incredibly strong 2019 where its price appreciated 53.6%. In total, palladium is up 3.3x over the past three years. Speculators have surely driven some of the momentum; nevertheless, palladium has been in a deficit since 2012 and without additional supply or a substitute product, we could continue to see strength.
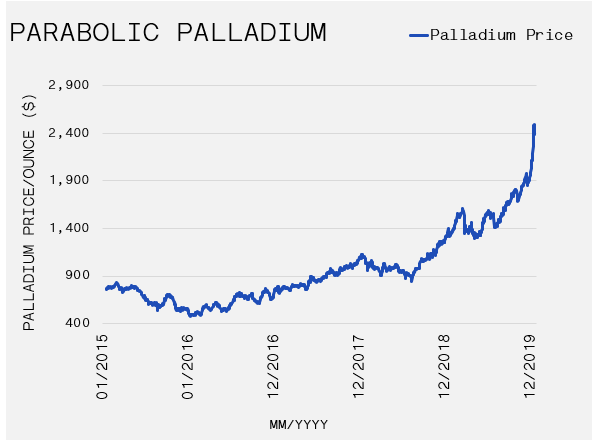
Oil continues to defy expectations, falling 5.0% for the month, despite an escalation of tensions in the Middle East following the killing of Qasem Soleimani, the Iranian leader of the Islamic Revolutionary Guard. The assassination and subsequent bombing of US command posts in Iraq temporarily boosted the oil price by 3% but it has since fallen 8.6% as of 20-Jan-20. Both sides of the conflict have declared that a diplomatic conclusion to the dispute is preferred. As such, some market participants have cited this as the reason for oil’s composure. In addition, the possible absence of Soleimani’s military influence provide hopes that middle east tensions may moderate in the future. However, the situation is nowhere near solved. Iran’s persistently threatens to withdraw from the Global Nuclear Deal if European countries refer Tehran to the UN Security Council for violating the 2015 pact. In the meantime, Canadian oil, measured by Western Canadian Select, has fallen 13.9% during the period. This drop has once again pushed the spread with WTI to a 40% discount – back to where it was in late 2018. The combination of record high inventories following a recent outage on the Keystone pipeline, and a Canadian National rail strike has cast doubt on Canada’s ability to reliably access the homeland’s oil. Record-breaking cold weather in Western Canada has added fuel to the fire. Two large crude producers were obligated to declare force majeure when they couldn’t fulfil their contracts due to an inability to process crude at extreme low temperatures. Natural gas is a key ingredient in the conversion of bitumen to synthetic crude, and freeze offs have restricted the supply available to producers.
More recently, reports of a new Chinese coronavirus (the virus responsible for SARS in 2003) have made headlines and are impacting global markets. On 20-Jan-20, the World Health Organization announced it would convene a meeting to declare a world health emergency. The virus started in the Wuhan province of China, where 258 confirmed cases and six deaths have been reported. The virus has already spread, and it is poised to worsen as the Chinese New Year (25-Jan-20) travel rush begins. Global markets have taken note, with the iShares MSCI Emerging Markets Index down 2.2% on 21-Jan-20.
January 01, 2020
Central Banks & Easing Trade Tensions Support Stocks into 2020
Fourth Quarter 2019 Newsletter
Stocks Accelerated Into Year End – The final quarter of the decade delivered impressive returns as trade tensions alleviated between China and the United States. The S&P 500 experienced its best annual performance since 2013 while Canada’s benchmark posted its biggest percentage rise since 2009. The improved global economic data combined with a weakening US dollar sparked a year-e...
Stocks Accelerated Into Year End – The final quarter of the decade delivered impressive returns as trade tensions alleviated between China and the United States. The S&P 500 experienced its best annual performance since 2013 while Canada’s benchmark posted its biggest percentage rise since 2009. The improved global economic data combined with a weakening US dollar sparked a year-end rally in Emerging Markets.
The US Treasury Yield Curve began to steepen in the fourth quarter. The Federal Reserve cut short-term interest rates in October for the third time in 2019. Investors felt the impacts of easy monetary conditions with an improving economic and inflation picture. The 10-year Treasury yield ended the year at 1.92%. The Bank of Canada bucked the global trend and chose to keep their target rate steady.
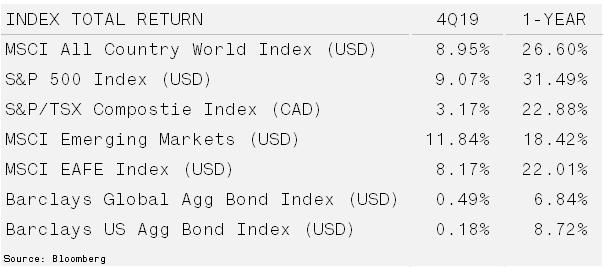
Can Ample Liquidity Overcome the Risks in 2020? – The remarkable returns in equity markets for 2019 were not driven by strong earnings growth. In fact, sales growth slowed while costs accelerated. This applied pressure on margins, causing overall earnings per share to remain flat. Despite this headwind, global markets surged to new all-time highs on multiple expansion. Investors were willing to pay more per share for a dollar of earnings.
Multiple expansion typically signifies higher growth prospects or at the very least improving economic and financial conditions. In this instance, multiples were extending because more than half of central banks cut interest rates in 2019. This was the largest amount of easing since the 2008 financial crisis. Monetary conditions were relaxed in response to persistent weakness in global manufacturing. The sector recorded its longest downturn in seven years.
The combination of low but improving growth with loose monetary conditions benefitted the Growth style of investing over value-oriented strategies. Furthermore, passive investing continues to constitute more of the market. As such, the valuation premiums enjoyed by large, liquid companies over lower float, less liquid, smaller capitalization companies should endure.
The “phase one” trade deal between the US and China may help restore corporate confidence. If management teams are more comfortable making long-term investment decisions, capital expenditures will boost revenues. The timing might even coincide with a rebound in global manufacturing which will also lift corporate profits.
With loose monetary policies, peace in the trade war and improving prospects for corporate spending, investors are anticipating an earnings recovery over the next few quarters. However, the threat of inflation and the US election cycle may extinguish the flicker of hope as the year progresses.
If the manufacturing sector has troughed and loose monetary conditions boost growth, the economic slack that restrained inflation may be eliminated. This would force the Federal Reserve’s hand into raising rates. In 2018, the Fed executed too quickly, and markets faltered. Inflation may arise from an energy shock, for example, if tensions rise between Iran and the US; or, from food prices, which are vulnerable to climate change, higher oil prices and a depreciation in the USD.
As for the election, if leftist economic policies gain support and either Bernie Sanders or Elizabeth Warren win the Democratic nomination, markets will be spooked. These policies are likely to hit at the heart of the current economic cycle, hurting corporate profit margins of large firms.
On balance, the bull-market appears to remain intact in the very short-term with ample liquidity, neutral expectations and reasonable valuations. As the calendar advances, we expect to become less constructive on risk assets. Our bond outlook remains steadfast and is summarized in our January 2019 Outlook.
December 18, 2019
The Highs & Lows of Cannabis
Smart Money
Outright prohibition of cannabis began in the United States in the 1920s. However, over the past several years cannabis legalization has been rapidly occurring across the United States, at the state level. In Canada, it is already legal for both recreational and medicinal purposes. The cannabis sativa plant has almost 500 natural components; as many as 70 of which are cannabinoids, ...
Outright prohibition of cannabis began in the United States in the 1920s. However, over the past several years cannabis legalization has been rapidly occurring across the United States, at the state level. In Canada, it is already legal for both recreational and medicinal purposes. The cannabis sativa plant has almost 500 natural components; as many as 70 of which are cannabinoids, chemicals that are unique to the plant. The push for legalization is led in large part by the medical discovery in the early 1990s of the endocannabinoid system, a complex cell-signaling system inside the human body. The possible applications for the constituents of cannabis are plentiful and vary across many industries, including healthcare, beverages, manufacturing, beauty & cosmetics, farming and more. Accordingly, growth in the cannabis sector could push upwards of 10 times over the next decade. Unfortunately, cannabis stock prices have crashed by over 70% from early-2019 peaks. Valuations are now in line with peer groups that have nowhere near the growth potential.
In the lead up to the Canadian legalization of cannabis for recreational purposes in 2018, the enthusiasm for cannabis stocks mimicked technology during the Dot-Com bubble in 2000. Nearly all the publicly listed companies operated without revenue, nevertheless speculation elevated prices without regard to fundamentals. However, capital support and investment from behemoth companies such as Constellation Brands, Anheuser-Busch and Altria, to name a few, fueled the excitement in the sector. Through 2018 and 2019, fundamentals improved, and firms reported sales growth ranging from 10x to 200x the levels earned in 2016. Despite the progress, profit expectations have not materialized and share prices have fallen precipitously. Access to capital and regulatory restrictions on interstate growth and acquisitions have also been harmful to valuations.
In the United States, cannabis remains illegal under federal law for any purpose as it is classified as a Schedule I substance, a category reserved for substances with a high potential for abuse and no accepted medical use. Despite the federal classification, the United States is the fastest growing market for cannabis as individual states have legalized cannabis for both medicinal and recreational purposes. The confusing system means that a business head-quartered in a legalized state, may simultaneously violate federal laws and be non-compliant in neighbouring states. The tangled legislation restricts capital and products from flowing across interstate borders.
As at December 2019, 40 states have allowed some form of legalized cannabis. State legalization has grown from just 17 at the end of 2010. Adoption has accelerated in large part due to the amendments of the Cole Memorandum, named the Rohrabacher-Farr amendment which bars federal prosecution of individuals who comply with their state’s medical cannabis laws. The rapid growth has created additional pressure for the federal government to address the legal discrepancy. This sets the stage for cannabis to be used as a political weapon in the 2020 election.
Current Democratic front-runner, Elizabeth Warren, introduced the Strengthening the Tenth Amendment Through Entrusting States Act (STATES Act) in June 2018. This legislation prohibits Federal interference with cannabis corporations operating legally within state guidelines. The STATES Act enjoys the most bipartisan support, this includes backing from President Trump. Further, in December 2018, Trump signed the omnibus Farm Bill, which redefined hemp as an agricultural product rather than a Schedule I substance. Hemp is a strain of the Cannabis sativa plant species that is grown specifically for industrial uses of its derived products.
On September 25, 2019, the House of Representatives voted in favour of the SAFE Banking Act, a bill aimed at giving clarity for financial regulations across the United States. If approved by the Senate, US operators would gain access to capital and can purchase common social services for employees such as insurance. The Bill however has not made it through the Senate, and if it is pushed until 2020 the process for approval will reset. Current Senate Banking Committee Chair Mike Crapo has been steadily softening his once hardline position on the subject. State Attorney Generals are pushing for change, as it is becoming more difficult to oversee the industry with no financial guidelines.
In addition to the momentum for legislative changes in the United States, there is a global push for rescheduling cannabis by the United Nations. In early 2019, the World Health Organization called for the whole marijuana plant to be removed from its most restrictive category of a 1961 convention. Such a shift by the United Nations would be a positive catalyst as additional nations would likely be more inclined to scale back or repeal their prohibition laws. It should be noted, however, that legalization for non-medical reasons would still violate global conventions and the vote which was scheduled for March 2019 was postponed with no clear indication on a new vote date.
Within a 24-month time frame, the cannabis industry has transitioned from stretched valuations to panicked selling. The thoughtless flogging is reminiscent of the beating undertaken by Amazon and Booking Holdings (formerly Priceline Group) when the Dot-Com bubble went bust. When Priceline IPO’d in 1999, it soared to a $23 billion market value. But by 2002, tanking tech stocks devalued its market cap to about $150 million. Today, the company’s value is approximately $85 billion. It would be reckless to suggest that Booking/Priceline history will repeat with the whole cannabis complex. Nevertheless, sentiment is approaching extreme negative levels at a time when growth is accelerating and structural impediments are fading. We anticipate that momentum will shift, as legislation and access to capital improve, and today’s investors will enjoy favorable outcomes in the long-term.
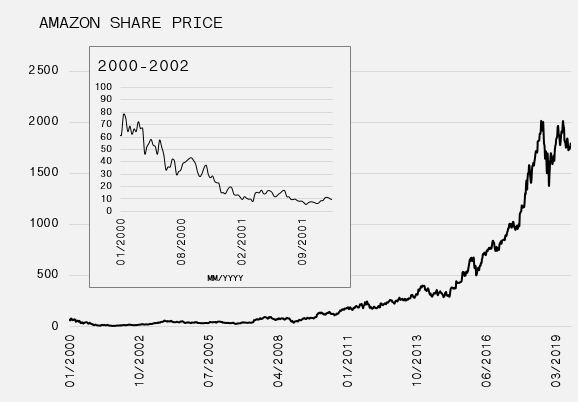
December 17, 2019
OPEC Cuts, Stalling Shale Boost Oil Prices
Market Recap & Box Score
The 2019 calendar years is shaping up to be the strongest year since 2013 for the S&P 500. North of the border, the TSX should post its strongest year since 2009. The results would have seemed unthinkable during Q4 of 2018 as markets were crashing and a recession was all but guaranteed. For the month ending 17-Dec-19, the S&P 500 and MSCI World indices gained 1.3% and 0.6%, ...
The 2019 calendar years is shaping up to be the strongest year since 2013 for the S&P 500. North of the border, the TSX should post its strongest year since 2009. The results would have seemed unthinkable during Q4 of 2018 as markets were crashing and a recession was all but guaranteed. For the month ending 17-Dec-19, the S&P 500 and MSCI World indices gained 1.3% and 0.6%, while the TSX was flat.
Equity strength continues to defy expectations despite lingering recession concerns. However, the economic slump sentiment seemed to subside when the employment survey from the US Bureau of Statistics was released on 06-Dec-19. The jobs market showed a very healthy gain of 266,000 (vs. expectations of 187,000) nonfarm jobs in November, along with an unemployment rate at 3.5% and a 3.1% bump in hourly earnings. While employment data has historically been a fairly backward-looking statistic, the news seemed correlated with a 1% rise in the S&P 500 for the day, and a break above the previous high for the month. A secondary, or perhaps primary, driver for the market was the Fed’s declaration that it would allow inflation to run above the 2% policy target. The justification that the rate has remained below target for enough time that allowing it to run above will bring the average to 2%. Readers may now wonder why a plan to let inflation rise may be good for markets, especially if they have read our past commentaries, but in this case it comes down to the lens with which a participant wants to view the market. In the short-term, this translates to sustained accommodation and zero quantitative tightening. If history repeats, this means prolonged asset inflation and a rise in equity markets. We won’t beat a dead horse, but if market participants decide to apply a longer-term lens, the implications of higher inflation could signify lower corporate margins, additional consumer stress through higher costs if wages don’t keep up, and the inevitable Fed scramble to temper expectations through make-up tightening down the road. It is easy to see the forest for the trees, but 2019 does not provide much of a reason to expect an imminent change in focus.
Speaking of inflation … ok, fine, just a couple more shots at said horse … rates and commodities seem to have started to sniff out a pickup during December. The US 10-year and 30-year yield both rose 10bps for the month as the yield curve steepened, meaning longer-term yields are rising via a perceived pickup in growth or inflation, while the short-term continues to be suppressed through dovish Fed policy. Elsewhere, copper climbed 5.3%, while weakness in the CRB US Spot Raw Industrials index reversed course, rising 2.6%. This one is fairly noteworthy as it includes things like steel, tin, burlap, cotton, cloth etc., in addition to copper, which is a diversified gauge of key economic inputs. Now one month does not a trend make. However, employment has historically been a lagging indicator, these commodities are a fairly accurate leading indicator, and can help form judgements of how things may unfold in the coming months.
Moving on to oil, WTI demonstrated strength during the month and moved through the $60 ceiling, up 4.6%. Helping drive the move was the result of December’s OPEC meeting. The 14 country cartel agreed to cut an additional 500K barrels per day, bringing the total cut to 1.7MM barrels per day, above consensus. Media outlets have suggested that the improved trade situation between the US and China could also impact expectations for global growth, and in turn demand for oil. Possibly related and likely more impactful, persistent negativity surrounding the trend in US shale oil productivity. Global supply has been profoundly impacted by shale over the past few years. Accordingly, weakness should be bullish for oil prices in the long-term. Shale basins lose 70% of production after year 1, and 35% of the remainder in year 2. The short life cycle of shale operations means that the taps could turn off even quicker than anticipated. Rapid depletion and tighter lending standards within the industry have caused concern for the US’s ability to grow production and pace global supply growth. As a result, there has been renewed enthusiasm in the narrative north of the border, with the S&P/TSX Energy Index rising 6.5% for the period.
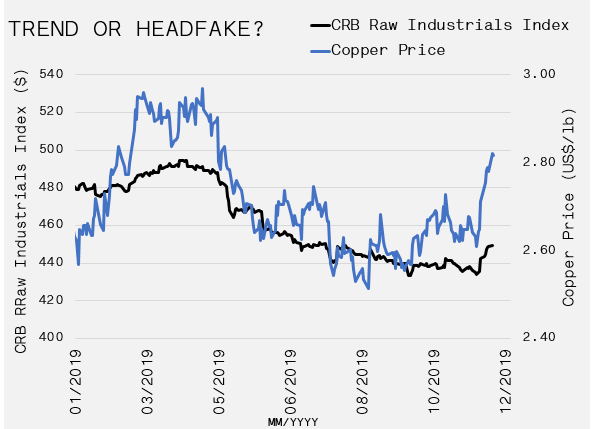
December 03, 2019
Charitable Goals & Financial Assists
Smart Money
Among professional athletes, hockey players are often viewed as philanthropic leaders. Take for instance the league-wide involvement in this past month’s Hockey Fights Cancer campaign, or the unrivaled participation in the always popular Movember competition. As the holiday season approaches, hockey players, like many others are reminded of their fortunate situations and the importanc...
Among professional athletes, hockey players are often viewed as philanthropic leaders. Take for instance the league-wide involvement in this past month’s Hockey Fights Cancer campaign, or the unrivaled participation in the always popular Movember competition. As the holiday season approaches, hockey players, like many others are reminded of their fortunate situations and the importance of supporting those less fortunate. To better understand how you can give back, GAVIN has outlined a variety of options and some important financial factors to consider.
November 29, 2019
Monitoring Spreads and Commodities for a Possible Reversal
Market Recap & Box Score
Coming into the seasonally strong end-of-year period, markets have so far toed the line. The S&P 500 (+3.5%), TSX (+4.2%) and MSCI (+3.0%) all posted strong gains in November. This marks a third consecutive month of strength for the S&P 500 and MSCI World Index as reduced impeachment risk and trade war optimism helped support the advances. BNP Paribas recently reported that o...
Coming into the seasonally strong end-of-year period, markets have so far toed the line. The S&P 500 (+3.5%), TSX (+4.2%) and MSCI (+3.0%) all posted strong gains in November. This marks a third consecutive month of strength for the S&P 500 and MSCI World Index as reduced impeachment risk and trade war optimism helped support the advances.
BNP Paribas recently reported that outflows from equity mutual funds and ETFs surpassed $150 billion during the past 6 months. Previous peaks in outflows occurred in 2016, 2011, 2008 and 2000 when markets were strikingly different than the all-time highs that are present today. As themarketear.com highlights, strong outperformance typically follows periods where outflows exceed $50 billion. Accordingly, the massive retail redemptions suggest that robust equity performance may persist. However, in this instance, negative fund flows could imply that markets are preparing to rollover. It is no secret that corporate buybacks have supported the upward momentum and that easy access to credit has funded the buybacks. At this point, the data does not indicate that the trend will reverse anytime soon. BBB and high yield issuers continue to have significant access to debt financing and spreads remain tight. Although, borrowers rated CCC and below have experienced widening spreads since Sep-18, but this portion of the market represents only 3% of US corporate debt outstanding. Comparatively, the BBB-B component of the market accounts for 66% of debt and most of the buyback flow. As a result, more attention is dedicated to the importance of the spread movements in those constituents.
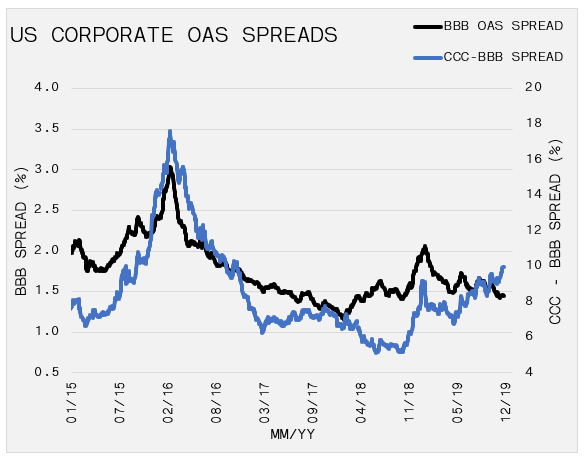
The TSX index shrugged off a tough October to post a 4.2% gain for the current period, good enough to lead US and the MSCI Indexes. Energy rebounded slightly during the month as the sector increased 4.2%. However, the 9.4% improvement in the Tech sector paced the TSX. Constellation Software (TSE: CSU) jumped 9.8% for the month to all-time highs on strong earnings, while Shopify and CGI both registered convincing returns.
Thank you to Kevin Muir, the macrotourist, for drawing attention to Canada’s inverted yield curve. When the US yield curve first inverted in April, many declared that this signaled a looming recession. Since then, the US curve has steepened, helping to alleviate some worries. But, yields in Canada continue to be inverted which essentially demonstrates that short-term lending conditions are too tight in relation to expectations for slower long-term growth, or a future reduction. Nevertheless, Canadian economic numbers continue to surprise to the upside; as such, the yield curve remains uncharacteristic for bullish forecasts.
Commodities generally had a quiet month, as oil maintains the $50-60 range ahead of OPEC’s meeting in early December. Demand for oil has cooled in 2019 due to slowing global growth. Supply has been held in check by planned OPEC cuts which are set to expire in March 2020. There are many reasons to believe US oil production will taper at some point, but so far this has not been the case. Unless OPEC’s production cuts persist, oil prices will struggle in 2020. Nonetheless, on a rate of change basis, we note that late Dec-18 marked the low for oil at $46, a steep decline from $76 in Oct-18. So, while rangebound in 2019, on a year-over-year basis we are exiting a period of weakness into a period of strength, which could have implications on inflation expectations to begin 2020. Bond markets were beginning to sense this in October and November as the US 10-year yield rose 41bps to 1.94% on 11-Nov-19, but have since backed-up to 1.77%. Copper similarly fell in November after a strong month in October.
Copper and oil, along with the CRB US Spot Raw Industrials index, will be closely monitored for signs of inflation. Inflation is present and growing at the consumer level, but its impact has not yet obstructed corporate fundamentals (margins, input costs) or influenced Fed policy from a macro perspective. One underappreciated commodity that has “logged” impressive gains is lumber, soaring 27% from its May low. Falling mortgage rates in the US sparked the housing market and intensified demand for lumber.
October 31, 2019
Hard Work and High Wages
Smart Money
For good reason, team captains are well paid. The approval of teammates and management is a reward in itself, but the player’s contract also provides compensation for the added responsibility. Whether the big money arrives before the “C”, or after, there is a strong relationship between the pay cheque and the designation. As we have illustrated in the attached exhibit, NHL captains ea...
For good reason, team captains are well paid. The approval of teammates and management is a reward in itself, but the player’s contract also provides compensation for the added responsibility. Whether the big money arrives before the “C”, or after, there is a strong relationship between the pay cheque and the designation. As we have illustrated in the attached exhibit, NHL captains earn 370% more than skaters who are without a letter.
October 29, 2019
WeWork-ing to Crush the IPO Market
Market Recap & Box Score
The S&P 500 and MSCI World Indices printed strong gains in consecutive months. October is closing in on 2.6% improvement as progress on the Chinese and US trade deal has invigorated the equity markets. The “Phase 1” announcement involves Chinese purchases of $40-50 billion of agricultural products from the US. In exchange, the US would cancel the tariff increase on $250 billion...
The S&P 500 and MSCI World Indices printed strong gains in consecutive months. October is closing in on 2.6% improvement as progress on the Chinese and US trade deal has invigorated the equity markets. The “Phase 1” announcement involves Chinese purchases of $40-50 billion of agricultural products from the US. In exchange, the US would cancel the tariff increase on $250 billion of Chinese imports that was scheduled to take effect on 15-Oct-19. Chinese President Xi and Trump are scheduled to meet on 17-Nov-19 where it is expected that final details will be put to paper. It’s important to understand the hot and cold nature of these trade negotiations. Since Chinese hacking/IP theft is not included in this phase, it seems to be a stopgap to show headway.
The TSX took a step back, down 1.6% for the period. Once again, the energy sector led the benchmark to the downside, by falling 8.6%. However, there were no sectors on the TSX that registered a gain for the month. Canadian energy names decoupled from oil before and after the Canadian election. In August, the energy sector climbed 13% as momentum began to build for the Conservative party. As it became clear that a Liberal minority was the most likely outcome, the trend reversed, along with Canadian oil as measured by Western Canadian Select. WCS tumbled 9.9% while West Texas Intermediate (WTI) slid just 1.1%. Outside of the preliminary move in oil, most markets were unaffected by the election, and the Loonie strengthened 0.4% versus the greenback.
Gold weakened during the month, down 1.1%. Some of the softness could be attributed to a reversal in the trend of falling yields globally, as both the US and German 10-year yields rose 17 and 23bps, respectively. Rising yields and a 3.1% lift in copper prices made for an interesting month on the macro front. Despite the short-term nature of the signals, the implications for inflation are intriguing.
One of the more interesting trends so far in 2019 has been the evolution of the IPO market in the US. As illustrated in the adjacent table, many of this year’s initial public offerings are trading significantly below their high or list prices. This weakness signals a major shift in investor expectation. The focus may be shifting from growth-at-any-cost to one where companies are expected to run a profitable business.
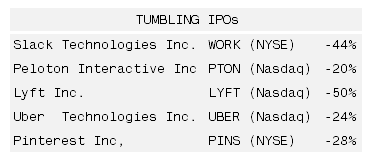
To put this in perspective, the five companies listed above are expected to lose a combined $4.4 billion in EBITDA in 2019 vs. revenues of $22.6 billion. Pinterest is the least egregious offender, responsibly burning through only $32.9 million in EBITDA. While public market prices revealed the change in sentiment, the spark was more likely related to a company still operating in the private market space, that being WeWork. Now it is clear from the numbers cited previously that investor penchant for due diligence has been severely compromised of late, but WeWork seems to have been the shot of adrenaline that the market needed to wake up to the reality. It doesn’t take a CFA designation to understand that the business model would not work. But, the public disclosure in WeWork’s S-1 provided the necessary awakening. This realization and the subsequent rejection by public markets slashed the company’s valuation from a reported peak of $47 billion to just $20 billion. Furthermore, the largest investor in the company, Softbank’s Vision Fund, seems to be the only bidder for the company. Without another suitor or an alternative source of funding, that $20 billion valuation may still seem exceptionally high. Moreover, the yield on WeWork’s bond (due in 2025) has spiked from a low of 6.8% in Aug-18 to a high of 13.0% in Oct-19. This signals that investors are not eager to continue to provide any debt funding.
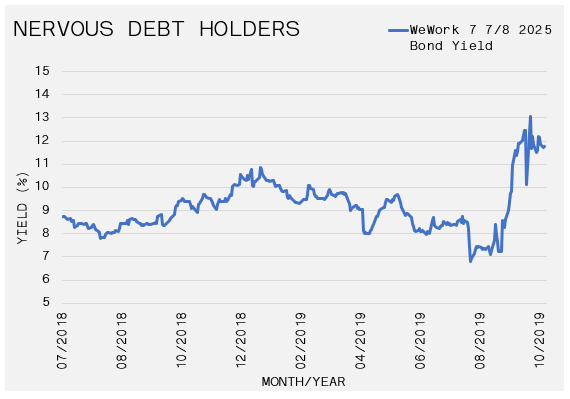
The consequences of this failure extend beyond WeWork. Softbank is the largest investor in Uber, Slack, and DoorDash, and a 26% holder of Alibaba, among others. Additionally, WeWork has approximately $50 billion in office leases, which represents the largest tenant in New York, London and San Francisco. Global property markets would be impacted if this occupant failed to meet their obligations.
October 15, 2019
Positioning For A Game Changer (Part II)
Third Quarter 2019 Newsletter
Up and Down, then Up Again – US equity markets registered new all-time highs in July, fell in August as risk-off price action took hold and ended the quarter back near their peaks. Similar themes caused the roller-coaster quarter. The on-again/off-again US-China trade war dominated the headlines as well as weak global growth, recession fears and central bank monetary policy. Canada’s...
Up and Down, then Up Again – US equity markets registered new all-time highs in July, fell in August as risk-off price action took hold and ended the quarter back near their peaks. Similar themes caused the roller-coaster quarter. The on-again/off-again US-China trade war dominated the headlines as well as weak global growth, recession fears and central bank monetary policy. Canada’s S&P/TSX Composite continued its strong 2019. However, energy stocks persistently underperform as crude prices slipped 8.5% during the quarter. Outside of North America, markets struggled to combat a slowdown in China that is reverberating through much of the globe.
The Federal Reserve embarked on a new easing cycle with two rate cuts. The long-end of the US yield curve fell dramatically, causing a temporary inversion of the 10-year and 2-year spread. The Canadian dollar slipped during the quarter, but still remains approximately 3% higher than at the beginning of the year against the US dollar.
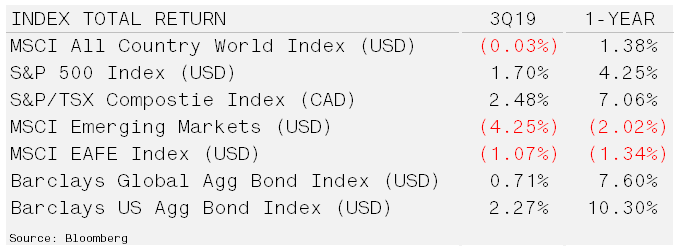
Paradigm Shifts & Turning Points – Following-up on our July 2019 issue, we continue to evaluate investment opportunities that are expected to outperform or at least be prevalent over the next decade. To recap, structural shifts in consensus beliefs appear to occur every ten years or so. This time frame applies to the formation of a championship hockey team and to investment allocation strategies. The transition often rewards early adopters. Eventually excessive optimism of the “New Paradigm” forms and mimicking becomes widespread. Ultimately, profits erode and the bubble bursts. This cycle was coined by George Soros as the theory of reflexivity.
The current investment views have been formed by events over the last decade. This period witnessed the failure by the US Federal Reserve to sustain inflation above its 2% inflation target, while wage growth has been 180 basis points less than the decade previous. Meanwhile since 2010, the S&P 500 Index has outperformed the MSCI World-Ex US Index by an average of 70 basis points per month. The Technology sector has been the leader with a 15.2% average annual return. Finally, the trade-weighted US dollar index is at its highest levels since tracking began, up over 30% over the trailing 10-year period.
Inflation
- Consensus
US core inflation rate has not breached 3% since the mid-90s. Debt, demographics and tighter monetary policy in developed economies will lead to a continuation of the current deflationary environment
- Contrarian View
Low labour costs (China and excess workers in US) along with falling commodity prices have masked inflationary pressures. If inflation picks up, long-term bonds are most at risk while commodity equities have both relative and absolute upside.
US Equities & Dollar
- Consensus
The US economy will continue to outperform, perhaps due to more desperate issues around the world. A shortage of US dollars will send the greenback higher eliminating the need to hedge currency risk.
- Contrarian View
The twin deficits in the US may come in to focus causing an outflow from the dollar should there be a sustained loss of confidence in US growth or fiscal prospects. International equities appear better relative plays while gold could stabilize a portfolio if economic uncertainty persists.
Technology
- Consensus
The top seven companies by market capitalization are technology firms. With near zero cost of capital and operating within oligopolies, technology giants will continue to expand their empires and profits.
- Contrarian View
Sheer size alone warrants caution as bigger organizations face more bureaucracy and government scrutiny. Meanwhile, China and the US now appear to have chosen technology supremacy as a matter of national security. Underweight US technology while focusing on smaller, more disruptive companies.
While positioning does not ensure annual outperformance, the probability of success increases due to a commitment to the process. A well diversified portfolio has an objective of long-term wealth creation rather than outperforming in any single year.
October 02, 2019
NHL Hockey Is Back!
Smart Money
The 2019-20 NHL season starts tonight! To ensure a player is financially prepared for the upcoming season, GAVIN has updated our annual Preseason Primer. The exhibit provides current and relevant financial data for the upcoming season; including pay periods, escrow rates, income tax rates, NHL group benefits and retirement contributions. Feel free to share The Preseason Primer; and, a...
The 2019-20 NHL season starts tonight! To ensure a player is financially prepared for the upcoming season, GAVIN has updated our annual Preseason Primer. The exhibit provides current and relevant financial data for the upcoming season; including pay periods, escrow rates, income tax rates, NHL group benefits and retirement contributions. Feel free to share The Preseason Primer; and, as always, let us know what you think.
September 25, 2019
Disruptive Drones and Unrest in Repos
Market Recap & Box Score
Global equity markets continued their whipsaw action; however, this time the movement was to the upside. The TSX, S&P 500 and MSCI World indices rose 5.4%, 5.3% and 4.8% during the period. A reversal in fund flows supported the stock markets, as recession fears faded and hopes for a U.S.-China trade deal grew. Accordingly, the US 10-year Treasury Yield climbed, initially rising ...
Global equity markets continued their whipsaw action; however, this time the movement was to the upside. The TSX, S&P 500 and MSCI World indices rose 5.4%, 5.3% and 4.8% during the period. A reversal in fund flows supported the stock markets, as recession fears faded and hopes for a U.S.-China trade deal grew. Accordingly, the US 10-year Treasury Yield climbed, initially rising 45bps to 1.90bps by mid-September before moving back down to end the period at 1.66%. Geopolitics returned to the headlines and contributed to the large move in bond yields. The most newsworthy event revolved around the attacks on two major oil facilities in Saudi Arabia on 14-Sep-19. While Yemen’s Houthi rebels claimed responsibility, the US and Saudi Arabia seem convinced of Iran’s involvement. As the accompanying chart illustrates, there has been an alarming growth in military exports of equipment to Saudi Arabia. As such, it is surprising that either Iranian or Houthi drones were able to cause such drastic damage. Recall that in 2017 President Trump brokered an arms deal with Saudi Arabia that was estimated to be worth $350 billion over 10 years. The agreement signified the economic alliance between the two countries and also served as a response to Iran’s malignant activity in the region.
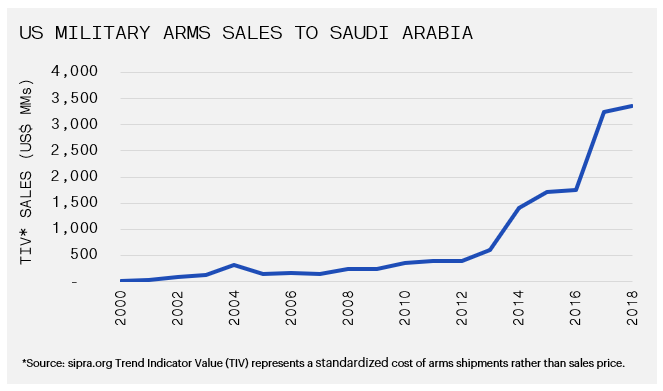
Oil benefited from the tensions in the Middle East as WTI spiked 14.7% on the day. Recently the price has retreated due to reports that the infrastructure is being repaired more quickly than anticipated. WTI finished the period up 6.1%. Bond yields are also responding to the action in oil prices. Oil is a key input for most consumer products and, as a result, it has an outsized impact on inflation. Inflation continues to be disregarded but a turnaround could spark a rout in bond prices.
During the week of 16-Sep-17, it was reported that repo and money market rates shot up to almost 10% on an overnight basis. Repurchase Agreements (repos) are used by banks to handle short-term cash needs. Banks borrow cash overnight in exchange for collateral (Treasury Bonds). Normally, these activities are carried out daily without interruption. However, the temporary spike in rates signaled that banks were short on cash. As such, these entities had to pay a large premium to access cash. The repo rate is influenced by the Fed Funds Rate (FFR), which is targeted to be 1.75%—2.00%. So, it is significant that the actual rate charged for banks to exchange their assets for cash spiked near 10%. Many reasons were cited as the cause for the disruption in the bond market.
There was a large increase of US bond issuance after the debt ceiling was raised in July. Since, banks are the primary dealers, they are legally required to purchase Treasuries with the intention to sell to end users. Consequently, cash had to be used to buy the Treasury Bonds.
Regulations have forced an enlarged requirement to hold reserves at the Fed since the Global Financial Crisis, limiting the ability for banks to provide liquidity in the repo market.
During the Fed’s Quantitative Tightening phase, cash that was previously added to Bank balance sheets in the form of reserves, has reversed and been drained to further stress liquidity.
Whatever the reason, the disorder forced the Fed to re-open their repo operation on an overnight and term basis to become the lender of cash. These measures calmed the market in the short-term, but longer-term uncertainty persists.
For the primary dealers who are buying US Treasury Bonds, is there inadequate investor demand to allow the banks to sell their inventory? Government debt as percentage of GDP has topped 100%, and it will become even higher given the prospect of federal deficits of at least $1 trillion. Is there enough of an investor appetite for more US bonds?
Also, how much capacity does the Fed have to support the repo market? Does this mean another round of Quantitative Easing to stabilize balance sheets and fund the deficits? Besides the Fed, Japan, China, and ETF holders (Vanguard/Blackrock), are the largest holders of Treasuries, so relying on continued foreign investment into the US is critical.
In summary, the cause for the repo market disruption is complicated and wide-ranging. And, ultimately, the short-term consequences may be benign – however, we learned in the Global Financial Crisis of 2007–09 that inadequate liquidity can jeopardize the survival of any bank.
August 29, 2019
Preparing for a New Season
Smart Money
The 2019-20 NHL season is right around the corner. Players and their families are preparing to depart for various NHL cities to attend training camp and to make sure their kids are ready for the start of school. These semi-annual moves can cause plenty of stress and confusion. To keep players organized for this summer’s travel, GAVIN created the attached checklist. Click the link be...
The 2019-20 NHL season is right around the corner. Players and their families are preparing to depart for various NHL cities to attend training camp and to make sure their kids are ready for the start of school. These semi-annual moves can cause plenty of stress and confusion. To keep players organized for this summer’s travel, GAVIN created the attached checklist. Click the link below to review the many planning considerations.
August 28, 2019
Fear Tightens its Grip on the Equity Markets
Market Recap & Box Score
Equity markets took a breather in August as investors seem to be considering the risks facing the global economy, while trade talks between the US and China became more aggressive. The MSCI World (USD) and S&P 500 led the declines, down 4.4% and 4.0% respectively for the period. The TSX’s 2.2% loss was softened by a 9.0% rise in the price of gold. Outside of precious metals, we...
Equity markets took a breather in August as investors seem to be considering the risks facing the global economy, while trade talks between the US and China became more aggressive. The MSCI World (USD) and S&P 500 led the declines, down 4.4% and 4.0% respectively for the period. The TSX’s 2.2% loss was softened by a 9.0% rise in the price of gold. Outside of precious metals, weakness in commodities is persistent due to reduced global demand. Copper fell 5.5%, and the CRB US Spot Raw Industrials Index slumped 1.3%. Both gauges have ignored equity market strength in 2019, which suggests that equity returns and inflation will be suppressed in the near future. WTI oil also slid 2.1% as it appears to be stabilizing around the $55 mark after a significant 25% decline from its October 2018 high of $75. Outside of primary markets, cannabis continues its lackluster 2019 campaign, with HMMJ sinking 14.5%. The sheen may have come off in the near-term but the long-term commitment is endorsed by political advances and medicinal progress.
US Government Treasury Bonds were a primary recipient of investor proceeds over the past several weeks. The 10-year and 30-year bond yields dropped to 1.49% and 1.97%, respectively. The yield on the 10-Year Treasury achieved a new three year-low, while the sub-2% yield on the 30-year bond is an all-time low. These low rates reveal the bond market’s expectations for tepid economic growth in the coming years. Further, there has been an abundance of media focus on the yield curve inversion and its proficiency as a precursor for a recession. Pundits debate whether the 2-year vs. 10-year is a better predictor than the 3 month vs. 5 year; but for investors; here is what you need to know.
-
- The short end of the yield curve (0-2 years) is controlled by the Federal Reserve or simply the central bank of the United States.
- The long-end (10-30 years) is much more fundamentally-driven, with two primary inputs; (1) growth of the economy and (2) inflation expectations.
- For simplicity, let’s assume there is no inflation, the bond market is pricing in sub-2% growth annually for the next 30 years.
- Overreliance on debt to fund growth acts to suppress future growth and carries disinflationary impacts. Accordingly, this contributes to the forecast for sub-2% growth. The current policy response to this low growth outlook and to defend against a recession is, ironically, to add more debt. While we don’t know if a recession is one, five, or ten years out, we do know the bond market is pricing one in. So, considering the bond market’s track record, it would pay to listen.
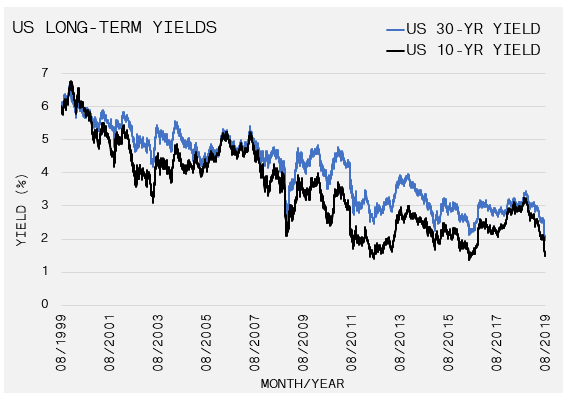
In summary, with the 30-year yield at all-time lows in the US, $15 Trillion in global debt yielding negative rates, manufacturing data contracting globally and most equity markets outside of the US in negative territory over the past year, we can be fairly certain a recession, or something close to, is forthcoming. However, the market is nowhere near euphoria. The S&P 500 put/call ratio, which is a measure of how much downside protection is being purchased in the option market, is at 2.15. Over the past year, this level has been typically reached when markets are close to a bottom. CNN’s Fear & Greed Index, which uses seven market indicators to gauge investor’s bullishness from a rating of 0 (Extreme Fear) to 100 (Extreme Greed), is at a sufficiently fearful grade of 21. What does this tell us? It tells us that investors are right to worry, and perhaps this is not the time to be 100% allocated to equities, but investor positioning could be hinting it is not quite time to dig a bunker and clear out Costco for its canned food. We remain cautiously optimistic and believe that the fear currently over taking the markets may be overdone in the short-term. The S&P is only ~5% off its highs, but fear has caused the stock of many companies to correct much further. Accordingly, many more long-term investment opportunities are being created by short-term fear.
July 29, 2019
Positioning For A Game Changer (Part I)
Second Quarter 2019 Newsletter
Volatile But Solid Quarter – Equity markets were broadly higher last quarter despite an escalation in US-China trade tensions and concerns of a global growth slowdown. The US once again led the group, returning 4.3% during the quarter and 10.42% over the trailing 12-months. The market rally was driven mostly by major central banks shifting their tone more clearly toward an easing bias...
Volatile But Solid Quarter – Equity markets were broadly higher last quarter despite an escalation in US-China trade tensions and concerns of a global growth slowdown. The US once again led the group, returning 4.3% during the quarter and 10.42% over the trailing 12-months. The market rally was driven mostly by major central banks shifting their tone more clearly toward an easing bias as they acknowledged the weak global economic backdrop.
Safe-haven assets such as government bonds and gold were also among the biggest gainers on expectations of interest rate cuts and the possibility of further monetary easing. The Canadian dollar advanced 5.66% against the greenback as US interest rates collapsed and the Canadian economy recovered from its first quarter stall.
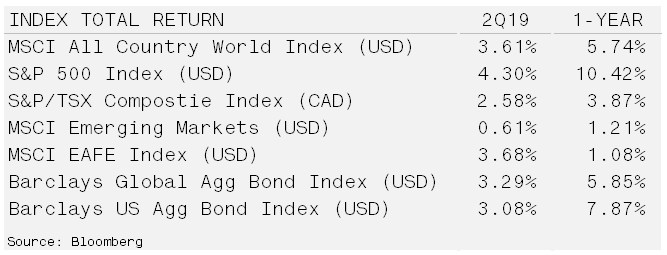
Paradigm Shifts & Turning Points – For those that have followed the National Hockey League closely, the paradigm shifts with regards to how the game is played have ebbed and flowed. The transitions from the “Run & Gun Era” (1984-‘94), to the “Dead Puck Era” (‘94-2004), the “Golden Era” (‘05-’15), and finally the “Precision Era” (’15-Today), required changing skill sets to generate success. During each turning point, teams that drafted and prepared well for the shift benefitted the most; Edmonton Oilers, New Jersey Devils, Chicago Blackhawks and Pittsburgh Penguins.
Analogous with eras in hockey, markets experience long-term changes that require structural modifications to portfolios. Early adopters typically see the largest benefits as teams/capital begin to accept and eventually mimic/support the strategy. In due course, a “New Paradigm” is declared because individuals become heavily influenced by current events. It is assumed the existing view will persist but the vast majority fail to anticipate shifts caused by the law of diminishing returns. The transition to a new path begins when a consensus view creates excessive optimism, encourages abnormal risk-taking and distorts valuations.
The 10-year time frame works in hockey and it also appears to hold up well in markets. Looking back at the last four decades there are distinct beliefs that become psychologically engrained in society. These prominent convictions become reflected in markets through valuations that teeter into “bubble territory.” Accordingly, avoiding the previous dominant themes and the largest stocks associated with the era can lead to outperformance over the next 10-years. The table below demonstrates this phenomenon.
1980 to 1989
- Beginning
Inflation exceeded 10% and bond yields were rising rapidly. Top 10 global stocks included five energy companies and nine were US domiciled.
- Ending
The best allocation decision was to underweight the US to hold zero energy companies as inflation receded.
1990 to 1999
- Beginning
Japanese equities dominated, owning eight of the top 10 equity positions by size while accounting for 45% of the global index. The core belief was Japan’s corporations held superior management techniques and banking systems.
- Ending
Simply underweighting Japan allowed a global investor to outperform as the Tokyo exchange peaked in 1990.
2000 to 2009
- Beginning
The internet and housing boom fostered the “new economy”. Technology, media and telecom stocks (TMT) comprised more than one-third of the MSCI World.
- Ending
Investors that performed well in the 2000s owned commodities and sold TMT.
2010 to 2019
- Beginning
Quantitative easing stoked concerns of inflation once again, while China’s growth and talk of peak oil helped push Chinese and commodity equities into the top 10.
- Ending
Best trade for 2010s was to underweight China and to be short commodity stocks.
Paradigm shifts do not signal a bleak future; conversely, the transition often leads to net gains. Technology stocks once again dominate the top 10 board by market share and the US now accounts for 56% of the MSCI World Index. However, the seeds that were sowed for this decade’s rich harvest are beginning to become unviable, similar to the one-dimensional enforcer in today’s NHL.
July 26, 2019
Equity Markets Rise Amid an Uncertain Economy
Market Recap & Box Score
Markets continued to perform well in July with the US leading the way. The S&P 500 posted a 3.6% gain for the period. The MSCI World and TSX lagged but still recorded strong gains, at 2.6% and 1.8%, respectively. In the US, technology (+7%) and financials (+6%) were leaders while healthcare and energy trailed. Expectations for lower short-term rates are a significant factor in...
Markets continued to perform well in July with the US leading the way. The S&P 500 posted a 3.6% gain for the period. The MSCI World and TSX lagged but still recorded strong gains, at 2.6% and 1.8%, respectively. In the US, technology (+7%) and financials (+6%) were leaders while healthcare and energy trailed.
Expectations for lower short-term rates are a significant factor in the markets upward trajectory. Growth sectors, such as technology, disproportionally benefit from lower rates because the cost of funding and discount rate produce a higher present value for these businesses. Financials are assessed differently because their valuation is derived from the yield curve, or the difference between long and short-term interest rates. Banks borrow on the short end and lend on the long end of the yield curve. Profitability is boosted when longer-term interest rates are higher than short-term. This worked against the financial sector in 2018 as the Fed sought to increase rates while the markets continued to price in low growth through suppressed long-term rates. In 2019, the trend has reversed. If the Fed allows inflation to “run hot”, the case can be made that the yield curve will steepen further, and momentum in financials will persist. The yield for the US 10-Year Treasury rose 11bps during the month, while WTI oil softened 2.6%, despite inventory data the was fundamentally strong.
Second quarter earnings season kicked off during the month. General expectations for Q2 were fairly bleak, especially lapping a robust 2018 when earnings were boosted by Trump-enacted tax cuts. Further, wage pressures, increased raw material (oil) costs, and global weakness in manufacturing and economic data were foretelling dim results. However, most companies have beaten expectations on both top and bottom-line numbers. Also, on 26-Jul-19, the US declared initial Q2 GDP growth of 2.1%, overcoming Wall Street estimates. With companies broadcasting solid results, a stubbornly resilient US economy and a supportive Fed, equity markets have potential to maintain an upward path. The downside case is supported by valuations that exceed historical averages and underlying indicators (inventory builds, government outlays, weak imports) that reveal softness in the economy.
As it relates to potential weak spots, the auto industry should be on the top of investors’ list of canaries. In the US, Ford disappointed and its stock lost up to 9% on the day of its earnings release. Guidance was cut and hints about capacity reductions continue. Overseas, Daimler (Mercedes-Benz), reported its first quarterly loss in a decade, though from a volume perspective, things were not as weak as headline numbers indicated. The company absorbed a €4.2 billion charge on diesel vehicle and air bag recalls. In the UK, stock of Aston Martin collapsed over 40% due to a reduced profit forecast. Meanwhile in Japan, Nissan announced 12,500 job cuts, or 10% of their workforce, as operating profit fell 99%. Globally, auto markets are one of the largest employers. Accordingly, when the sector faulters, it augurs poorly for consumer health, and in turn the economy.
Precious metals had an interesting month as gold took a breather after a very strong June. Conversely, silver ascended 7.2%, in an attempt to close the gap with gold in 2019. It is important to try to make sense of the fuel that is propelling gold. According to Commitment of Traders report, speculators and producers are crowded on the long side, while expectations for rate cuts from the Federal Reserve are at extreme dovish levels. This has been the case for most of the bull run, yet prices withstand the strain. In a slow growth, benign inflation world, where $15 trillion of global bonds exhibit negative yields, gold becomes an enduring and attractive asset.
In contrast to gold, industrial metals, are used in a wide variety of construction and manufacturing applications. As such, copper prices, for example, can be a barometer for the economy. In July, at a time, when gold prices paused, copper may have found a bottom in its downward cycle that began in early 2018. The price movement of these two metals could have predictive power for the course of growth and interest rates.
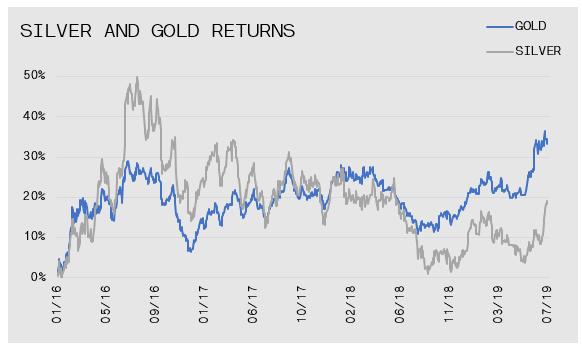
June 27, 2019
An Offer They Can’t Refuse?
Smart Money
A player will find themselves in one of two situations when their NHL contract expires, either an unrestricted free agent (UFA) or restricted free agent (RFA). UFAs have the ability of select from among the teams who have offered a new contract. However, this luxury is only tendered to players who meet the minimum age and/or service requirements. For those classified as RFAs, the abil...
A player will find themselves in one of two situations when their NHL contract expires, either an unrestricted free agent (UFA) or restricted free agent (RFA). UFAs have the ability of select from among the teams who have offered a new contract. However, this luxury is only tendered to players who meet the minimum age and/or service requirements. For those classified as RFAs, the ability to negotiate is much more limited. Check out the link below as the rights for an RFA are explained.
June 26, 2019
Don’t Sell In May, The Fed Will Save The Day?
Market Recap & Box Score
While our headline generation may be called into question, the question of whether the Fed’s rate hiking cycle is over was temporarily put to bed in June, helping to lift markets globally. The S&P 500, MSCI World, and TSX indices all ended in the green, up 4.4%, 4.0%, and 1.4%, respectively as the TSX gave back its May outperformance. Beginning with some hat-tipping from Fed mem...
While our headline generation may be called into question, the question of whether the Fed’s rate hiking cycle is over was temporarily put to bed in June, helping to lift markets globally. The S&P 500, MSCI World, and TSX indices all ended in the green, up 4.4%, 4.0%, and 1.4%, respectively as the TSX gave back its May outperformance. Beginning with some hat-tipping from Fed members and concluding with the Fed statement on 19-Jun-19, investors were calmed as the probability of a 2019 rate reduction moved to 100%. Two primary beneficiaries of the news were gold and US treasury yields. Gold bugs celebrated as it initially broke through its 2011 downtrend line and since held above the $1,400 level, ending the month up 10.3%. The US 10-year yield broke through 2%, ending the month down 145bps to 1.99%, a meaningful decline from 3.23% in Oct-18. The movement in yields and gold prices validate the Fed’s message – the future rate path of interest rates will be downward in the absence of inflation.
An interesting dichotomy has developed in markets in 2019; market exuberance driven by a dovish Fed contrasted with a sluggish economy that is forcing the Fed to provide stimulus. Global manufacturing has decreased materially, with the Markit Economics Composite World PMI shrinking to 51.2, approaching its 2016 lows. This has been compounded by questions around the soundness of Chinese bank liquidity, a slowing global auto market and perhaps most importantly, a continued decline in the CRB Raw Industrials Spot Price Index. This CRB index is a gauge of the prices of key industrial inputs and ‘boots on the ground’ measure of economic activity. Geopolitically, the US and Iran are one bullet away from military conflict.
However, one key lesson learned since 2009 is that data alone does not necessitate a market pullback, and in the absence of a spark, euphoria can and will continue. The prospect of easing US/China trade tensions, perhaps as early as the July G-20 meeting, and an amicable Fed could sustain the tailwind. The Fed’s preference for a weaker US dollar will be valuable for improving the competitiveness of domestic exporter and for boosting corporate margins. Foreigners who are servicing USD denominated debt will also get relief from a lower greenback.
One sector that has not read the “everything must go up” memo in 2019 has been lumber and its producers. After a strong period of outperformance beginning in late 2016 to mid-2018, these companies have been struggling to find a bottom, with industry leaders Canfor and West Fraser losing 67.9% and 38.2%, respectively. The “outperformance” of West Fraser highlights the issues facing the industry as a confluence of environmental and political realities hit the BC lumber market, where Canfor has staked the largest claim. First, the mountain pine beetle epidemic destroyed large swaths of timber across BC. However, lumber remains economically viable for up to 8 years after the tree is dead, so supply available to loggers increased up to 2017. The beetle created more dead timber, lowering input costs and increasing capacity. Since then, the trend has reversed, which when combined with an increase in wildfires has drastically reduced supply, increasing stumpage rates and reducing margins and capacity simultaneously. Compounding this has been an anticipated increase to stumpage rates on 01-Jul-19 and the passage of Bill-22 in BC. The bill restricts the ability of companies to transfer their tenure, or logging rights, to another company. These factors have combined to create massive uncertainty in BC and daily announcements of mill shutdowns or curtailments. Canfor CEO Don Kayne estimates that up to two billion board feet of lumber capacity will have to be eliminated to match market forces, which points to further shutdowns upcoming. We are beginning to see green shoots in the industry, as lower interest rates have potentially stabilized housing demand. The corresponding demand for lumber, combined with capacity cuts pushed composite lumber prices up 32.5% this month. That said, the index is still down 34.8% from its May-18 high. Lumber provides a lesson in market cyclicality and the opportunities and risks inherent within it.
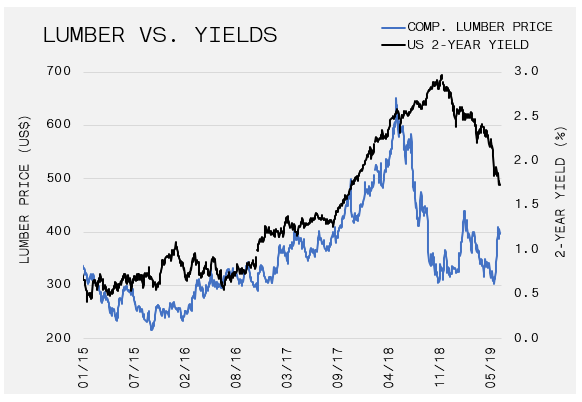
May 31, 2019
The Real Estate Combine
Smart Money
There are certainly more differences than similarities between athletes and your typical 9-to-5 employee. Nevertheless, both face important financial decisions and possibly the most important is when to buy a home. For an athlete, the choice often surfaces at a much younger age albeit with more financial flexibility and disposable income. But because you can afford it, does it always ...
There are certainly more differences than similarities between athletes and your typical 9-to-5 employee. Nevertheless, both face important financial decisions and possibly the most important is when to buy a home. For an athlete, the choice often surfaces at a much younger age albeit with more financial flexibility and disposable income. But because you can afford it, does it always make sense to buy? Click the button below as we consider the true cost of home ownership.
We also included a couple of links to short videos that prospective home buyers should watch. Enjoy!
How much did you make selling your house? Are you sure?
May 27, 2019
Hostilities Between U.S. and China Disturb Investors
Market Recap & Box Score
“Sell in May and go away” rang true in 2019 as markets gave back their April gains. This marks the first down month in markets for 2019, with the S&P 500, MSCI World, and TSX all dropping 3.3%, 3.1% and 1.3%, respectively. It seems that global growth concerns are back on the table, with tensions between US and China highlighting the issue during the month. On 8-May-19, Presiden...
“Sell in May and go away” rang true in 2019 as markets gave back their April gains. This marks the first down month in markets for 2019, with the S&P 500, MSCI World, and TSX all dropping 3.3%, 3.1% and 1.3%, respectively. It seems that global growth concerns are back on the table, with tensions between US and China highlighting the issue during the month. On 8-May-19, President Trump raised Tariffs on $200Bn worth of goods from China from 10% to 25% in hopes of hastening the signing of a trade agreement between the two countries. While many foresaw the tactic working and a quick end to the negotiations, it seems that it has done nothing more than further solidify each party’s position. Caught at the center of the negotiations are questions surrounding the prospect of a new technology cold war. Trump struck the first blow, inking an executive order to restrict US tech purchases by foreign adversaries deemed a national security risk. There is no secret that the target is Chinese alleged State-Owned Enterprise Huawei, as the move cuts off Huawei’s supply of key inputs such as semiconductors and Google’s Android operating system which are mission critical to the future of the business. Perhaps, more importantly, this could end its reign as the leader in global 5G next generation technology. One would think Trump, who sees the stock market as his primary report card, would want a quick end to the negotiation should markets weaken further. He has never been one to take the high road so time will tell. Treasuries and copper are both telling us trade wars are bad for the economy, with copper down 8.1% in May, and the 10-year treasury yield down to 2.32%.
Equity investors were not the only ones left licking their wounds, with oil reversing consecutive 11% gains to drop 10% on the month. Chinese buyers were reported by Reuters to be refusing to sign long-term supply agreements with US producers, instead utilizing supply out of Iran, Russia, and evidently Saudi Arabia, who reported a 43% increase in oil exports to China in April. This may help explain the relative outperformance of Brent Crude, down 5.0%, outperforming WTI by 5.0%. Also impacting fundamentals is seasonal refinery maintenance, moved up this year by IMO 2020. IMO 2020 refers to new shipping regulations requiring the use of more environmentally friendly fuel. Many refiners are expecting increased pricing for the product, front-loading maintenance to operate at full capacity ahead of the Jan-20 switch, helping to increase crude and fuel inventories.
The outlier in equities was the TSX, with financials, energy, and mining all taking a hit, on the surface one would have expected the TSX to be down materially vs. its global peers. However, during the month the index was propped up by technology and industrial shares. Industrials were boosted through airline M&A as WestJet agreed to be taken private by Onex Corp and reports swirled of an Air Canada takeover of Air Transat. Tech strength was driven by CGI and Shopify. SHOP is now up 107% year-to-date as their e-commerce solution continues to drive strong revenue growth. SHOP is looking to corner the market for all their merchant’s needs, including Shopify Shipping handling the shipping needs of over 40% of merchants, and Shopify Capital providing $87.8MM in merchant cash advances and loans during Q1, in addition to the launch of a new chip reader. Investors seem to be confident in SHOP’s ability to execute on all angles, with Price to Sales based on guidance for 2019 coming in at 24.9x, vs Amazon at 3.3x. We also note that on 4-Apr-19, short-seller Andrew Left of Citron Research came public with a short report which sent shares down 6% on the day, citing competitive pressure from such companies as Microsoft, Square, and Facebook in a market where SHOP was operating in unison previously. There are two winners from this report, the investors with the foresight to buy the dip and realize a 43% gain since, and the Robin Hood Foundation where Mr. Left promised to donate $200,000 if SHOP traded above US$ 200 in 12 months’ time (US$ 275 as of 27-May-19).
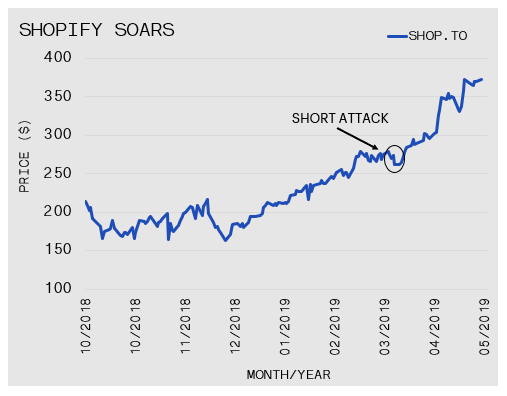
April 30, 2019
Teeing Up The Offseason
Smart Money
One of the most popular summer pastimes for an NHL athlete is the sport of golf. Accordingly, we are often asked to provide guidance for players who are considering a private membership. From a financial perspective, it is impossible to justify the ongoing costs associated with a golf membership. However, professional athletes with otherwise disciplined cash flow habits, can afford th...
One of the most popular summer pastimes for an NHL athlete is the sport of golf. Accordingly, we are often asked to provide guidance for players who are considering a private membership. From a financial perspective, it is impossible to justify the ongoing costs associated with a golf membership. However, professional athletes with otherwise disciplined cash flow habits, can afford this type of indulgence. After all, everyone needs a hobby! It is important to engage in a healthy distraction after the stress and grind of an NHL season. Click the link below to learn more about the world of private golf.
April 23, 2019
Fund Flows Supporting Equity Market
Market Recap & Box Score
The equity rally stretched for another month as the MSCI World, TSX, and S&P 500 posted gains of 3.4%, 3.5% and 3.9%, respectively. On a total return basis, the S&P 500 is now up 24.4% from its Christmas Eve low and 16.6% year-to-date. Even more interesting, earnings season has only just begun and with an absence of positive signals from a macro perspective, these gains have...
The equity rally stretched for another month as the MSCI World, TSX, and S&P 500 posted gains of 3.4%, 3.5% and 3.9%, respectively. On a total return basis, the S&P 500 is now up 24.4% from its Christmas Eve low and 16.6% year-to-date. Even more interesting, earnings season has only just begun and with an absence of positive signals from a macro perspective, these gains have been driven purely through multiple expansion. Despite calls for a stock market reversal from some of the smartest minds in finance; share repurchases, hedge fund short covering and retail fund flows have fueled the advance. SentimenTrader tracks retail flows via the Dumb Money Confidence Index. The indicator has been climbing steadily and it recently reached its highest level in a decade.
Fundamentally, we cannot refute the ‘smart money’ call for a re-test of the December lows. A slowdown in global GDP growth forecasts, potential margin compression and weakness in industrial production for export-driven countries (Germany and South Korea) support the bearish scenario. However, fundamentals act more as a rudder rather than a motor in the short to medium-term. Accordingly, fund flows remain the market’s engine, specifically corporate buybacks are fueling the machine.
What is driving the buybacks and potentially the market? The embedded chart illustrates the growth of US corporate debt issuance since 1996. Following the 2007 crisis, US debt issuance has been on a sustained upswing, while the growth of high yield debt over the same period has been even more pronounced. Notably, corporate debt issuance diminished in 2011 and 2018. The chart does not capture the drastic slowdown in corporate debt in late 2015, in anticipation of the Federal Reserves’ first rate increase in December. As a result, a backlog of mergers and acquisitions that had yet to be financed slid from $246bn at the end of September to more than $900bn. Coincidently, these calendar years (2011, 2015 and 2018) were the three years since 2008 where the S&P 500 was either flat or down.
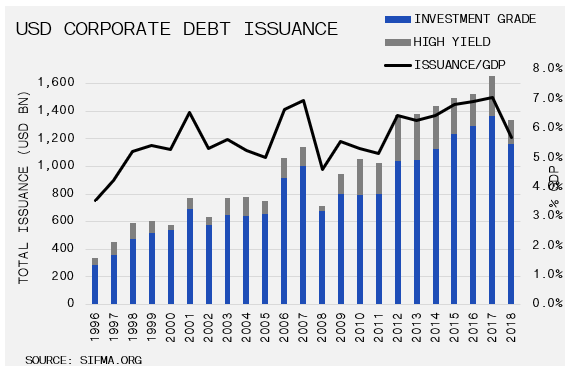
So, what is happening 2019? At the recent March meeting, the Fed Committee announced their intention to halt any further rate hikes in 2019 and complete its balance sheet roll-off program by the end of September. While many cite the Fed’s surrender to the stock market, it seems like credit market conditions were the impetus. Mr. Powell did not hesitate to raise rates in Dec-18 following a 10% drop in equity markets in Oct-18. However, when there was a 90% decline in credit issuance, the plan for hike rates and balance sheet runoff was quickly cancelled. This pivot seemed to hit the mark as credit markets opened-up. Investment Grade issuance rose from $9.1Bn to $106.6Bn, month over month. Similarly, high yield issuance leaped from $0.9Bn to $20.4Bn. Equity markets followed suit; after the 9.18% collapse in Dec-18, the S&P500 has jumped 16.6% in 2019.
Which leads us to another piece of the puzzle, that being inflation and the underlying commodity prices that drive it. April brought on a second consecutive 11.0% rise in the price of WTI oil to $65.50. The latest bump was in response to Trump’s call to end any waivers on countries importing Iranian oil. Not only does this escalate the current feud between the two countries but it essentially removes Iran’s 1.5MM barrels of oil per day from the market. With oil continuing to trend higher, the potential short-term effect on inflation and on interest rate policy will be noteworthy. An uptick in inflation could have a knock-on effect through the erosion of corporate margins. Further, if it forces the Fed’s hand, or alters the markets’ expectations from the Fed, debt markets will come under pressure. Within precious metals, both gold and silver took a breather in April, down 2.9% and 2.6%, respectively.
April 17, 2019
Yield Curve Signaling
First Quarter 2019 Newsletter
Markets Snap Back After Federal Reserve Pivot – While the fourth quarter of 2018 produced some of the worst data since the Great Depression, the first quarter of 2019 reversed that, posting its best start in nearly 20 years. Although the clouds around Brexit are still hanging over the global market, there is increasing optimism surrounding the US-China trade talks and a turnaround in ...
Markets Snap Back After Federal Reserve Pivot – While the fourth quarter of 2018 produced some of the worst data since the Great Depression, the first quarter of 2019 reversed that, posting its best start in nearly 20 years. Although the clouds around Brexit are still hanging over the global market, there is increasing optimism surrounding the US-China trade talks and a turnaround in the US Federal Reserve’s monetary policy stance. After stating interest rate hikes were on autopilot, Federal Reserve Chairman Powell reversed course with a rate hike pause and followed-up with news that quantitative tightening would come to an end by September. US equity markets continue to outpace global counterparts, although a higher dollar and wage cost increases will likely pressure corporate margins in the quarters to come.
US Treasury bond yields continued their descent, boosting returns to both high-quality and high-yield bonds. The all-important yield curve continued to invert during the quarter, with the 10-year Treasury bond yield falling below 3-month Treasuries.
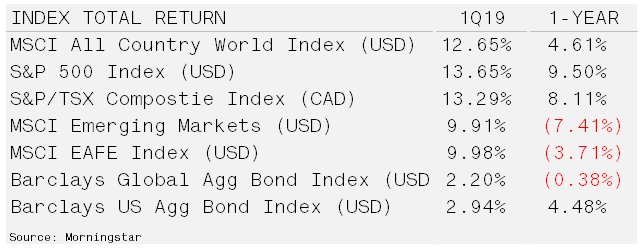
Yield Curve Inverts Signaling Economic Slowdown – During the first quarter, 10-year Treasury yields fell below 3-month Treasury yields, inverting the yield curve. Curve inversions have preceded the past seven recessions. However, on 10% of the occasions, an inversion does not lead to a recession. So, what does an inverted yield curve actually mean?
The main yield curve reflects government bond yields across a time series that is as short as one day and extends out to 30-years. Front-end, or overnight, rates are set by the Federal Reserve while all other rates are determined by the market. The importance of these “risk-free” rates cannot be understated as they determine the price of all other asset classes.
When the front-end interest rate rises faster than the market-setting long-term rates, it impacts markets and the economy in two ways. The first is the impact on asset prices and the second is the effects on lending. The first impact is more intuitive, as the reward for holding cash rises, long-duration asset prices decline due to funds flowing into cash. Long-duration assets include both bonds and real estate as well as stocks, in particular growth equities which are priced as the present value of future cash flows.
The second impact takes a bit more explaining. As the yield curve flattens, this causes a strain on lending as well as the broader economy. Banks for example borrow on the front-end and lend at the long-end, when the curve is inverted the spread becomes negative. Less lending is almost assured to slow the economy and because this is reflexive – the slowing economy will beget more restrictive lending.
Tightening credit/liquidity is often felt in the riskiest areas of the economy first. This could explain the current flood of initial public offerings (IPOs) that are coming to market. Companies like Levi Strass & Co., LYFT, UBER and Pintrest are possibly raising capital in public markets because private markets cannot keep pace with liquidity needs or have no further capacity for financings.
Since 1965, however, the time between inversion and recession has varied significantly, ranging between 8 and 33 months, with an average of 19. A top in the US market has typically preceded recessions by only an average of seven months. Most of the stock market damage is incurred prior to the recession. The average peak-to-recession lost is -14.6%. Meanwhile, stock market performance during a recession is generally flat on average. Additionally, there have been two “head fakes” in which the curve steepened, and expansion continued. The 10% anomaly is perhaps upon us.
For investors with short-term needs for cash, the timing for taking profits in long-term assets is suitable especially given higher yields in short duration securities. For long-term investors, the yield curve inversion, should not be a signal to hastily dump stocks. Opportunity is becoming more apparent in value-based equities because these rely less on higher residual values.
March 29, 2019
Winning The Tax Game
Smart Money
As April approaches, the on-ice focus of most professional hockey players remains on their upcoming playoff push. In the player advisory world, the April tax deadlines are our version of a playoff push. Many fail to consider the complexity involved in filing taxes for a professional athlete. While some complain of federal and provincial filing requirements, an NHL athlete often has a ...
As April approaches, the on-ice focus of most professional hockey players remains on their upcoming playoff push. In the player advisory world, the April tax deadlines are our version of a playoff push. Many fail to consider the complexity involved in filing taxes for a professional athlete. While some complain of federal and provincial filing requirements, an NHL athlete often has a filing requirement in each jurisdiction in which they play. This means a typical NHL player can file upwards of fifteen tax returns! Check the links below to view our checklists, designed to simplify your annual obligation.
March 23, 2019
Global Growth Alarm Bells Buzzing
Market Recap & Boxscore
Equities continued to climb through the first few weeks of the month, although enthusiasm has been slightly more muted. The S&P 500 and MSCI World rose 2.7% and 2.3%, respectively, while the TSX took a back seat for the first time in 2019, rising 1.7% for the period. Within the US, tech shares were resurrected, ascending 8% over the past several weeks. Utilities and REITs also...
Equities continued to climb through the first few weeks of the month, although enthusiasm has been slightly more muted. The S&P 500 and MSCI World rose 2.7% and 2.3%, respectively, while the TSX took a back seat for the first time in 2019, rising 1.7% for the period.
Within the US, tech shares were resurrected, ascending 8% over the past several weeks. Utilities and REITs also continue to outperform, lifted through falling rates and growth concerns. Related to growth, industrials have been the primary drag as manufacturing data begins to sputter. On the commodities front, oil continues to grain momentum, up 3.1% for the month and now 27.8% on the year as OPEC supply cuts and some positive weekly data offset global growth fears. Gold was a tale of two tapes, dropping 1.9% overall but recent strength was derived from resurfacing economic worries and the Fed’s pivot (discussed below). Cannabis stocks continue their market-leading ascent; Horizons Marijuana Life Sciences Index ETF (HMMJ) increased 9.3%. The proxy has now registered a 63% gain for the year and hit its Oct-18 highs. Many anticipate that new peaks will be reached as policy momentum builds south of the border.
One of the largest macro stories during March was the ‘dovish’ Fed statement made on 20-Mar-19. Most market participants seemed to be clinging to the belief that the Fed President, Jerome Powell, would be different. Many believed he would turn the tide of accommodative leaders and tighten monetary policy irrespective of the sentiment in capital markets. However, any remaining optimism was washed out when the Fed delivered a triple whammy; lowering growth expectations from 2.3% to 2.1%; eliminating calls for any additional hikes in 2019 (vs. two previously estimated); and, announcing they would continue to roll over principal payments for Treasury securities, effectively ending the tapering program. While some understood that any two out of three statements were possible, the overly dovish stance seemed to have taken many by surprise. Predictably, the main beneficiaries were gold and Treasuries. By surrendering the tools to manipulate rates and lowering growth expectations, the Fed effectively pushed longer-term yields down. With neither concern over growth or inflation, longer-term yields will remain under pressure prompting fears of a yield curve inversion and the prospect of a rate cut to counteract any steepening. Nevertheless, we remain focused on inflation, as a shock may be on the horizon if oil prices relentlessly grind upward.
Despite rising equity markets, some of the underlying trends have been less constructive. The German Manufacturing Purchasing Managers Index, or PMI, data released on 22-Mar-19 revealed a third successive month of contraction. Being a primarily export-driven economy, the deterioration has fanned the flames of global growth fears. Cracks seem to be forming in Europe’s strongest economy. Germany faces trade negotiations not only with the US, but also China, and an impending UK Brexit. Terrible timing given recession signals growing in France and Spain, while Italy’s economy has slipped into its third recession in a decade. The automotive industry represents a large proportion of Germany’s exports. As such, profit warnings from Daimler AG and BMW, intensified the distress. These alarms have compounded to drive German 10-year bond yields into negative territory. European banks become reluctant to lend in this environment as their earnings from interest rate spreads are compressed. European companies rely more heavily on bank lending to fund operations as compared to the US who borrow more heavily in wholesale markets.
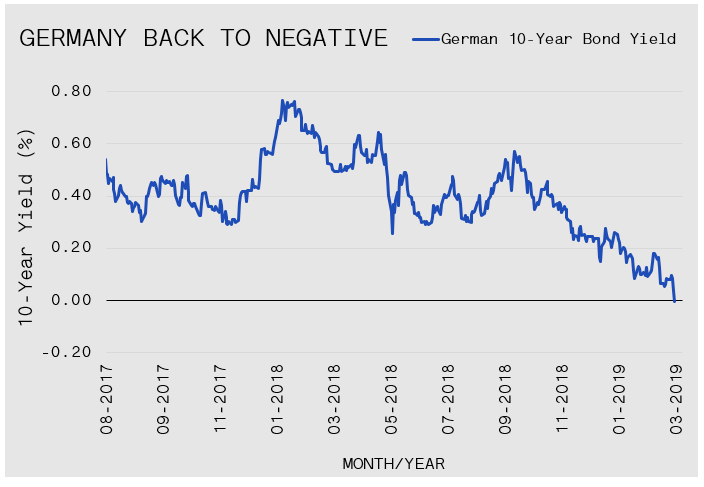
A staggering Europe and weak Chinese data hint that the US outlook may be fading as well. The US 10-year bond yield confirmed this sentiment, dropping to sub 2.5%. Given German bond yields are below zero and the Fed’s dovish posture, it would suggest that the differential in 10-year government bond yields is too wide. Unless there is an uptick in inflation, the US yield will have to move lower as we enter the second quarter of 2019.
February 25, 2019
Low Rates and Government Initiatives Power Global Markets
Market Recap & Box Score
The strobe lights stayed on through February as cupid came and refused to leave. The S&P, TSX and MSCI World Indices registered strong gains across the board, rising 6.3%, 5.4% and 4.5%, respectively. Two political tailwinds have been cited as reasons for optimism. First, the January US Federal Reserve minutes were published which referenced a “patient” stance when it comes to fur...
The strobe lights stayed on through February as cupid came and refused to leave. The S&P, TSX and MSCI World Indices registered strong gains across the board, rising 6.3%, 5.4% and 4.5%, respectively. Two political tailwinds have been cited as reasons for optimism. First, the January US Federal Reserve minutes were published which referenced a “patient” stance when it comes to further rate hikes and balance sheet deleveraging. Comments related to interest rates generally grab the headlines when the Fed issues a report. However, the markets got a shot of dopamine when it signaled that the end to balance sheet reduction would occur in 2019. Next, progress in Chinese trade talks were repeatedly awarded front-page status. On 25-Feb-19, President Trump stoked expectations for a successful conclusion to trade talks, saying he anticipated signing an agreement with Chinese President Xi Jinping “fairly soon.” This statement followed the cancellation of tariffs that were originally planned to go into effect 1-Mar-19. The import levies were slated to rise to 25% from 10%. The change would have significantly increased the trade war’s economic costs. In response to the positive developments, the Shanghai Composite soared 5.6% on a single day.
Gold continues to shine, rising 4.1% in February and a 12.3% from its low in September 2018. There has been no shortage of reasons to justify the price movement, from geopolitical concerns, central bank purchases, and perhaps most of all the continued momentum building behind governments (further) embracing debt as a tool to support public policy. Despite a swing from a US$236 billion surplus in 2000 to a US$779 billion deficit in 2018, the dire consequences of irresponsible and unnecessary spending have not appeared. Accordingly, the absence of these ill-effects is being interpreted as confirmation of successful fiscal engineering. As public policy is increasingly inclined to support a deficit, potential currency impacts could surface, which will increase the allure of gold as a store of value. Copper’s strength persisted into February, rising 12.6% during the period. The recent move was triggered by stockpiles held in warehouses operated by the LME dropping to their lowest level since 2005. A large jump in imports by China may explain the drawdown, which supports the positive impact that the country’s recent stimulus measures are having on global trade and global equity markets. Oil once again echoed this sentiment, rising 3.8% for the month despite record inventory reported.
Credit spreads in the US are replicating the optimism in equity markets. The ICE BofAML US Corporate BBB OAS dropped another 13bps to 1.71%, down from 2.05% at the start of the year. After a sustained contraction from over 3% in 2016 to sub 1.2% in early 2018, the measure is now riding along the bottom level of its 2018 range so the next move will be interesting to monitor. Highlighting the enthusiasm that 2019 has brought on has been the strength in WeWork’s 2025 bonds. WeWork seems to be somewhat of a fashion symbol for easy access to capital. To simplify the business model, WeWork will lease office space around the globe, fix it up to create a collaborative work environment, and then sublease on an as-needed basis to small businesses. The business required a heavy investment. IT reported net loss of $723 million for the first half of 2018 and rent commitments of $18 billion over the next decade. The Japanese multi-national conglomerate, SoftBank Group Corp. planned to acquire a majority stake in WeWork, but it needed to curtail its investment after it faced opposition from two main investors. The decision had a significant impact on WeWork bonds, as yields rose from 8.5% at its April issue date to 10.8% on 16-Jan-19. However, as credit markets rallied along with equity markets, the yield on these bonds have followed suit, dropping to 9.25% as of 25-Feb-19. For a business with large commitments and little security in revenue (tenants may terminate their agreement in one month), the availability and more importantly, cost of financing will certainly have a big impact on their ability to operate. We fear that the future of these bonds may correlate to many companies financed by cheap debt and questionable business models.
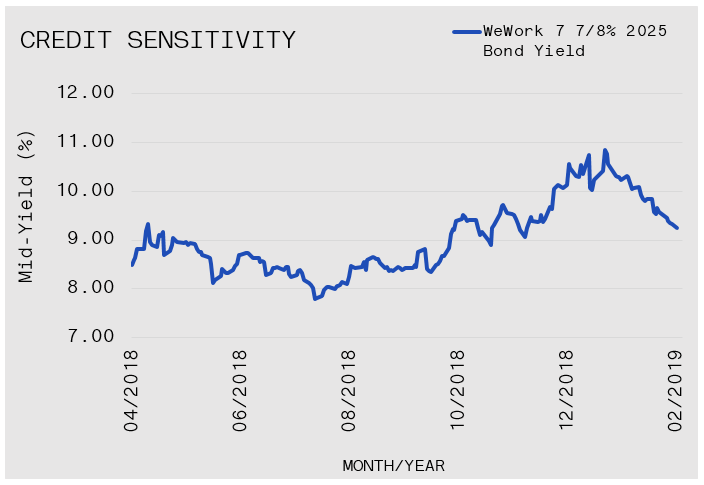
January 31, 2019
GAVIN Equity Portfolio – Canadian Investors
Annualized Return of 11.7% Since Inception
GAVIN manages approximately 25% of each client’s portfolio with direct exposure to between 15 and 25 companies that are publicly traded in North America. The equity portfolio has achieved an annualized, 4-year return of 11.7%, as at 31-Dec-18. These results handily beat the benchmark’s 5.8% return. In addition to high potential returns, managing a segregated equity portfolio pro...
GAVIN manages approximately 25% of each client’s portfolio with direct exposure to between 15 and 25 companies that are publicly traded in North America. The equity portfolio has achieved an annualized, 4-year return of 11.7%, as at 31-Dec-18. These results handily beat the benchmark’s 5.8% return. In addition to high potential returns, managing a segregated equity portfolio provides cost savings, the greatest flexibility for tax planning and improved transparency. Check out the fact sheet to learn more about GAVIN’s equity portfolio.
January 30, 2019
GAVIN Equity Portfolio – US Investors
Annualized Return of 10.5% Since Inception
GAVIN manages approximately 25% of each client’s portfolio with direct exposure to between 15 and 25 companies that are publicly traded in North America. The equity portfolio has achieved an annualized, 4-year return of 10.5%, as at 31-Dec-18. These results handily beat the benchmark’s 5.8% return. In addition to high potential returns, managing a segregated equity portfolio pro...
GAVIN manages approximately 25% of each client’s portfolio with direct exposure to between 15 and 25 companies that are publicly traded in North America. The equity portfolio has achieved an annualized, 4-year return of 10.5%, as at 31-Dec-18. These results handily beat the benchmark’s 5.8% return. In addition to high potential returns, managing a segregated equity portfolio provides cost savings, the greatest flexibility for tax planning and improved transparency. Check out the fact sheet to learn more about GAVIN’s equity portfolio.
January 21, 2019
Staying The Course Proves Useful Early In New Year
Market Recap & Boxscore
So far in 2019, everyone, except the shorts, has made money. From global equity markets, to commodities, treasuries and gold, markets have started the year on a cautiously optimistic tone. Within equity markets, the TSX led the way up 8.5%, bolstered by a 17.5% appreciation in the price of oil. The S&P 500 followed suit, printing an 8.4% gain, while the MSCI World lagged with a...
So far in 2019, everyone, except the shorts, has made money. From global equity markets, to commodities, treasuries and gold, markets have started the year on a cautiously optimistic tone. Within equity markets, the TSX led the way up 8.5%, bolstered by a 17.5% appreciation in the price of oil. The S&P 500 followed suit, printing an 8.4% gain, while the MSCI World lagged with a still impressive 7.5% showing. Justification for the rebound include the easing of US-Chinese trade tensions, optimism that the US government shutdown is nearing an end and a possible slowdown in the Fed hiking cycle. However, we know full well that no single explanation can justify a rally, and the rationale for renewed optimism boils down to “the price is up.” While we do not rule out the re-testing of highs on the S&P 500, especially considering the unified level of pessimism built into market over the final quarter of 2018, we also cannot discount the importance the market has placed on commentary coming from an increasingly unpredictable Federal Reserve. Investors should tread carefully in 2019, but keep in mind that the past three months have highlighted that maintaining exposure to potential upside surprises is prudent, especially when the headlines suggest running for the exits.
Oil seemed to reach a near-term bottom when it briefly touched $42.50 in Dec-18. Since then, it rallied 26.8% in just under a month to $53.90 as of 21-Jan-19. While there has been commentary regarding OPEC’s planned supply cuts, the more important driver has been the continued rig count reduction in US Shale regions. On 18-Jan-19, Baker Hughes reported a 25-rig reduction in the US, representing a 2.4% decrease. However, the rig count is still up 14% year-over-year. Further, for the week ending 11-Jan-19, the EIA estimated US production to be a record 11.9 million barrels per day. Accordingly, we would not forecast an imminent rise to $100. Nevertheless, low oil prices and higher interest rates are two primary factors that will weaken the region. With the oil price now rising and rate increases taking a breather, the renewed optimism may have created an opportunity for profit-taking and right-sizing positions ahead of a more long-term trend.
The Canadian dollar benefitted from the aforementioned commodity strength, climbing 1.7% over the past month and reversing a prolonged period of weakness since mid-2018. The sharp rebound has caused CAD to trade near the upper-end of its 2018 range; but it could be ripe for a pullback, especially considering recent fundamental news. The Financial Post reported that Canadians owe nearly $1.78 in debt for every $1 in disposable income. This regrettable situation is likely weighing on housing according to CREA, the average home price fell 4.9% in 2018. Also, in December, a US hedge fund, Crescat Capital, reported that over 80% of nonfinancial corporations in Canada reported negative free cash flow in the past twelve months. Looking forward, the prospects for a stronger loonie rest on continued vitality in oil prices or a reversal in the US Federal Reserve’s interest rate course. Otherwise, the overextended consumer, struggling corporations and a dovish Bank of Canada suggests that the movement will be to the downside.
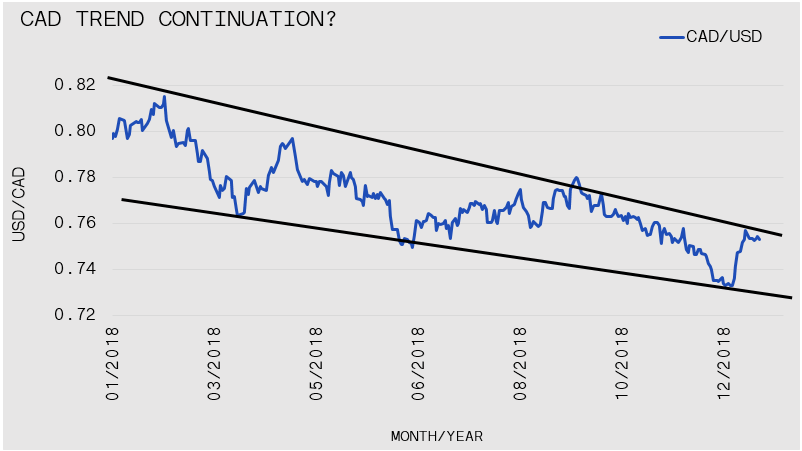
Elsewhere in commodities, gold continued its upswing, bumping-up 1.6% to $1,280 and marking five consecutive months without a monthly drop, corresponding to a cumulative 10% surge since its July 2018 low. There are many factors converging in gold’s favour, namely the perceived Fed reversal (or at least a pivot to dovish policy), tepid inflation and a general rise in political risks and market volatility. However, gold’s breakout has been less tied to 10-year Treasury yields and the price of copper. Copper’s many industrial capacities link it to economic activity. Accordingly, copper prices often signal opposite trends for gold. Similarly, Treasury yields will fall along with copper prices when a downtrend is anticipated. This phenomenon has been on display since Sep-18, as the US 10-year yields fell from 3.23% to 2.68% as of Dec-18. However, since the calendar turned, copper has rallied 5.9% while gold seems to be flattening and longer-term bond prices have fallen. Meanwhile, equity markets have rebounded from a hellish December. Correlations and causations may be murky, but this turn of events highlights the risks of committing to an exclusively bearish strategy – sometimes the road not taken is the better choice.
January 01, 2019
Equities Set-Up for Better 2019, But …
Fourth Quarter 2018 Newsletter
Economic and Geopolitical Concerns Catch Up to Markets – The final quarter capped off a volatile 2018, with most asset classes producing negative returns for the year. Global equities fell sharply during the fourth quarter with some indexes entering bear market territory (20% or more below their 52-week high) in December. The one month drop in US stocks in December was the largest mon...
Economic and Geopolitical Concerns Catch Up to Markets – The final quarter capped off a volatile 2018, with most asset classes producing negative returns for the year. Global equities fell sharply during the fourth quarter with some indexes entering bear market territory (20% or more below their 52-week high) in December. The one month drop in US stocks in December was the largest monthly decline since February 2009 and the worst December since the Great Depression. This shift was triggered by the base case economic outlook that a global recession was on the horizon as car sales fell 10%, crude retreated 45% from its recent peak and housing starts declined over 6%.
US government bonds and gold provided investors some insulation against the global selloff. The 10-Year US Treasury yield began the quarter around 3.07% but finished the quarter at just 2.69% while investment grade bond prices also turned higher after a difficult nine-month period.
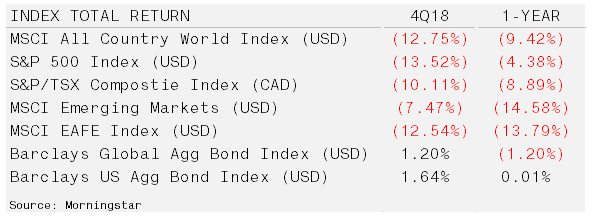
Set-up More Positive Than 2018 But … – While forecasts are often a fool’s game, particularly in the short-term, we can for the moment enjoy a victory lap on our 2018 predictions. In our outlook letter, we stated “a 10% setback is plausible if the Price-to-Earnings multiple backs up to 16.5x, even with a $150 earnings figure. However, at this point it appears that any pullback will be merely corrective as the emergence of a recession in 2018 is doubtful.” With no recession emerging, the market experienced two 10% corrections, with new highs re-established following the February decline. Furthermore, our preference for bonds over stocks was also applicable, although our short duration did not result in a meaningful performance upgrade.
That was then, however, and this is now. Following a 20% decline in US equities from 09-Sep-18 to 24-Dec-18 and a solid corporate earnings year, valuations have been restored to more reasonable levels. The plunge also caused the State Street Investor Confidence Index to sink to its lowest level since 2012 and market breadth is at a level that is most often associated with turning points – the number of stocks trading above their 200-day average is just 20%. Nothing changes sentiment like price. This set-up bodes well for at least a short-term rally and we are slightly more constructive on US equities for 2019.
However, US stock valuations remain at the upper levels of historical ranges. The often cited cyclically-adjusted price-to-earnings (CAPE) multiple sits at 27.5x versus the 40-year average of 21.7x. Meanwhile, the Warren Buffett Yardstick (US equity market cap-to-gross national product) stands at 128%, well off its recent highs but nowhere near the 65%-75% range that has marked the last two major bottoms. Accordingly, valuations are not inexpensive and potential mean reversion in margins provide headwinds for material gains over the next four to five years.
After growing in sync for the last few years, economies around the world are now set for a downturn. Ned Davis Research, among a plethora of brokerage firms, are predicting a high probability of a global recession. Many international markets, particularly emerging markets, have already adjusted. Within our growth allocation, we prefer corporations with global exposure as well as commodity-linked equities given their favourable relative and absolute valuations, including energy, agriculture and precious metals.
GAVIN will maintain a disciplined and meaningful allocation of short-duration sovereign bonds as our bias is for a continued, albeit slow, cycle of rate increases over the next few years. US companies have ratcheted up $9 trillion in debt since 2008/09, or 46.2% of GDP, from about $5 trillion in 2007. There are $3 trillion of triple-B (BBB) bonds outstanding, comprising nearly half of the Investment Grade universe, up from about 20% a decade ago. If the cycle turns, investment grade corporate debt appears to be vulnerable.
December 21, 2018
The Business of the WJHC
Smart Money
Every December, many passionate hockey fans switch their attention from the NHL to the World Junior Hockey Championships. The tournament provides an opportunity for viewers to catch a glimpse of tomorrow’s NHL superstars as they battle for their respective countries. With the endless coverage and constant spotlight, GAVIN took a closer look at the business side of the exciting e...
Every December, many passionate hockey fans switch their attention from the NHL to the World Junior Hockey Championships. The tournament provides an opportunity for viewers to catch a glimpse of tomorrow’s NHL superstars as they battle for their respective countries. With the endless coverage and constant spotlight, GAVIN took a closer look at the business side of the exciting event. Check it out below!
December 18, 2018
No Sight of Santa. Stocks Don’t Rally Into Christmas.
Market Recap & Boxscore
So far in December, investors have harnessed memories of childhood as they eagerly anticipate the Santa Claus rally that has so often come to pass over the past ten years. However, so far it seems that St. Nick may be lost in the clouds as global indices hint towards another down month and if things hold, a negative 2018. The MSCI World and TSX Total Return indices led the way to the ...
So far in December, investors have harnessed memories of childhood as they eagerly anticipate the Santa Claus rally that has so often come to pass over the past ten years. However, so far it seems that St. Nick may be lost in the clouds as global indices hint towards another down month and if things hold, a negative 2018. The MSCI World and TSX Total Return indices led the way to the downside, both posting 1.6% one-month decreases from 20-Nov-18, while the S&P 500 fared slightly better, down 1.4%. YTD on a total return basis, the S&P 500 is down 0.9%, while the TSX and MSCI World will have a tough time eking out a gain for the year, down 7.4% and 5.9%, respectively. To make matters worse, bonds have failed to provide the diversification benefit investors have come to rely on, with the Barclays Aggregate Bond Index registering a 0.9% drop for the year. The Canadian investor relying on a 60/40 portfolio and who failed to diversify globally has certainly taken a hit in 2018, as this portfolio would be down 4.1%. At this point cash may end up being the 2018 investment of the year which is interesting considering the pressure some of our managers were getting a year ago for holding cash. It is always interesting to see how sentiment shifts with the direction of the stock market arrow. This time is no different as the consensus has swung from global synchronized growth to an all-but-guaranteed recession early in 2019. Analyzing ETF fund flows helps put some context to the impact that these headlines have on investors. As markets took a dive in the last week, ETFs focused on industrials and energy reported large outflows while utilities and staples attracted new investors, which is to be expected. Gold and silver continue to be strong, up 1.6% and 2.0%, respectively. Support for precious metals is derived from weak equity markets and the Federal Reserve positioning shift. Despite positive headlines, Cannabis-related stocks have been weak, signaling either a tapped-out retail investor or overly ambitious hopes.
We commented in November on the turnaround that was surfacing in Emerging Market equities. Interestingly, December was another strong month, as measured by EEM, which was up 0.9%. The gains oddly came on the back of a rising USD (+0.7% for the month) and despite the trade talk impasse. The improvement could be related to Fed Chair Powell’s disclosure that the path for any further rate increases is uncertain. During the November meeting, language changed from the benchmark rate being “far from neutral” to “just below neutral”. The commentary pushed short-term rates lower; the 2-year yield slipped 20bps to 2.65%. And, it impacted longer-term rates, the 10-year yield dropped 25bps to 2.83%. Many intelligent pundits were citing 3.25% as the yield which if crossed, would trigger a long-term breakout in rates but this has not come to pass. For the time being, macro fundamentals have directed the ship as the global growth narrative has shifted to one of slowing growth.
Oil has been a consistent area of focus for both this newsletter and Canadian market participants for some time, particularly the price and discount of Canadian Western Select. During December however, Canadian oil came roaring back, up 116% as Alberta Premier Notley announced an 8.7% oil production cut, reducing oil output by 375K barrels per day beginning 01-Jan-19. These cuts will remain in force until the 35MM barrels currently sitting in storage are shipped to the market, likely until the spring. In addition, by year-end 2019, the government plans to purchase railcars capable of transporting 120K barrels per day.
Despite the development, Canadian oil companies continue to languish. The BMO Equal Weighted Oil & Gas ETF fell 8.6% during the month. The absence of a rebound in equities indicates that the bounce may be unsustainable – probably due to the lack of pipeline and export capacity. Elsewhere, WTI oil was down 3.9% during the month, despite the announcement of a 1.2MM barrel per day cut from OPEC. It seems that many are skeptical of OPEC’s ability to follow-through on the announcement or the prospect of increasing supply of US Shale.
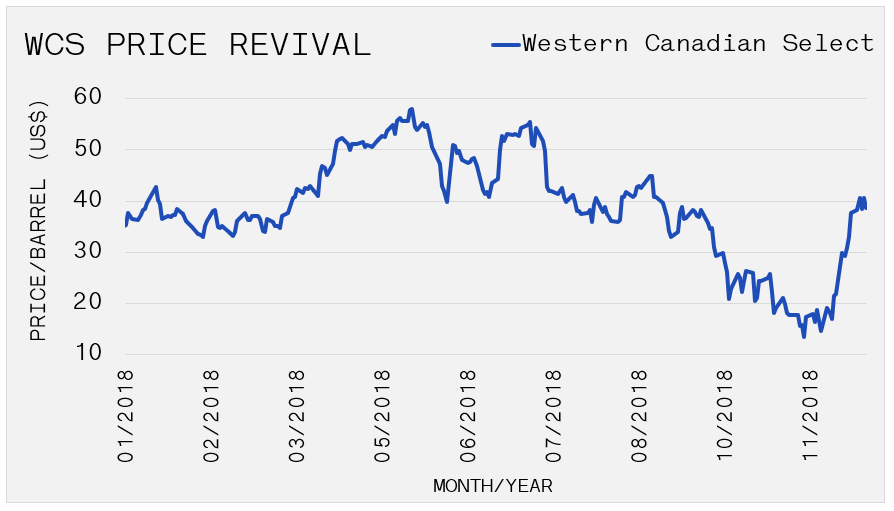
November 29, 2018
The Private Investment Combine
Feature Topic
With their visible salaries and powerful social platforms, it is not surprising to learn that professional hockey players are prime candidates for early-stage businesses that are seeking direct investments. Accordingly, as the Hockey Wealth Specialists, significant resources and time are dedicated to evaluating opportunities. Whether the opportunity is brought to the player from a fam...
With their visible salaries and powerful social platforms, it is not surprising to learn that professional hockey players are prime candidates for early-stage businesses that are seeking direct investments. Accordingly, as the Hockey Wealth Specialists, significant resources and time are dedicated to evaluating opportunities. Whether the opportunity is brought to the player from a family member, friend or teammate, a rigorous due diligence process is needed before any investment is made. Check out the brief summary for some fundamental considerations for those who are curious about private investment.
November 21, 2018
Stocks and Oil Slide Into US Thanksgiving
Market Recap & Boxscore
October weakness continued through to Thanksgiving in the United States. The S&P 500, MSCI World and TSX fell 2.4%, 2.1% and 0.9%, respectively, during the first few weeks of November. The large market cap names who piloted the rally were also the drivers on the downside; Apple (-19.2%), Netflix (-17.9%), Amazon (- 15.4%) and Facebook (-12.2%). Digging deeper into the eleven secto...
October weakness continued through to Thanksgiving in the United States. The S&P 500, MSCI World and TSX fell 2.4%, 2.1% and 0.9%, respectively, during the first few weeks of November. The large market cap names who piloted the rally were also the drivers on the downside; Apple (-19.2%), Netflix (-17.9%), Amazon (- 15.4%) and Facebook (-12.2%). Digging deeper into the eleven sectors of the S&P 500, only Health Care (+0.8%), Materials (+2.5%), Real Estate (2.8%) and Utilities (0.2%) were positive.
It seems that Emerging Market equities may have turned a corner despite the challenges in global developed equity markets. During November, iShares MSCI Emerging Markets Index ETF (EEM) gained 0.8% despite the heavy weighting in Technology. Elsewhere, gold and US Treasuries both exhibited strength, with bullion rising 0.6% and US 10-year yield dropping 8bps to 3.06%, marking two consecutive months of strength following the 3.20% 5-Oct 2018 peak in yield. Despite gold’s performance, most commodities were down. The slowing global growth narrative was stoked by dim hard data measures such as the Purchasing Managers’ Index and Durable Goods purchases.
Fears of slowing global growth spilled over into oil markets as WTI followed a 12% drop in October with an 18% plunge. There have been no shortages of headlines to justify the decline.
- President Trump’s support for Saudi Arabia has reduced anxiety in the Middle East.
- OPEC’s ability and/or willingness to cut production has diminished.
- Forced liquidation of long oil/short natural gas positions by large investment funds.
We remarked in past commentaries that most investors seemed to be on the bullish side of the oil trade. Certainly, timing a reversal is rarely successful, but recognizing the risk of a shift helps protect wealth over time. Sentiment was such that any of the above headlines could have caused a setback for oil, while few upside surprises remained.
Fundamentally, it is interesting to observe the chart of oil consumption vs. production from 1970 to 2017, and contrast it with global growth’s impact on overall demand for oil. Despite almost 50 years and six recessions, consumption of oil has been fairly consistent – only the 1973-75 OPEC production cut-driven recession had a material impact. We understand the potential long-term impact of alternative energy and electric vehicles, but in the near term, we still anticipate consistent demand being met by production that runs slightly below the consumption line. As the chart on the left demonstrates, there would have been an oil shortfall without the ramp in US production originating in 2008. Most of the advancement in US oil production has come from shale. Any hiccup with extraction of shale oil could become a catalyst for a sharp price move to the upside. Further, there are unappreciated cost-sensitivities in the shale industry. The highly indebted sector is beginning to experience a rising interest rate environment; and, the land in the Permian has appreciated from $2,000 per acre in the early 2000s to $95,000 per acre in November 2018.

Speaking of indebtedness, the market has finally acknowledged the massive corporate debt load that escalated thanks to easy borrowing terms and an unquenchable thirst from investors. Without an extension in the unprecedented low interest rate environment or the cash flow to pay off existing balance sheet debt, companies such as General Electric, Ford Motor Company, or Anheuser Busch have become candidates for downgrades. Current interest rate coverage ratios support stability and the economy remains strong but rising borrowing costs or a slowdown in business can quickly become problematic for over-levered organizations.
November 01, 2018
Investing In Your Children
Feature Topic
For those with the means, most parents prioritize saving for their children’s education. Many families accomplish this by opening a non-registered investment account (or bank account). These accounts have the benefit of simplicity and flexibility, but are not structured optimally for tax efficiency or asset protection. Alternative strategies include establishing formal trusts, investi...
For those with the means, most parents prioritize saving for their children’s education. Many families accomplish this by opening a non-registered investment account (or bank account). These accounts have the benefit of simplicity and flexibility, but are not structured optimally for tax efficiency or asset protection. Alternative strategies include establishing formal trusts, investing in permanent life insurance policies or taking advantage of income splitting through family businesses. However, governments in Canada and the United States have established prescribed programs for promoting post-secondary education savings. The infograph below provides a cheat sheet for persons on both sides of the border.
October 29, 2018
October Slump Flattens Market for the Year
Market Recap & Boxscore
“Markets take the stairs up and the elevator down.” While many were starting to believe that the upward sloping stairs may last forever, October brought a harsh reality to market participants, with the S&P 500, MSCI World, and TSX down 9.6%, 9.6% and 8.2%, respectively. Rising rates, trade wars, and emerging market narratives contributed to the downside momentum. But the concerns ...
“Markets take the stairs up and the elevator down.” While many were starting to believe that the upward sloping stairs may last forever, October brought a harsh reality to market participants, with the S&P 500, MSCI World, and TSX down 9.6%, 9.6% and 8.2%, respectively. Rising rates, trade wars, and emerging market narratives contributed to the downside momentum. But the concerns expressed by management teams in third quarter earnings calls accelerated the slide. A constant drumbeat of increased cost pressure has tempered expectations for earnings growth, despite approximately 77% of companies beating expectations thus far. Earnings have been lifted by tax cuts and cost cutting – many firms have reduced expenses to year 2008-levels. As a result, options for earnings growth come down to good, old-fashioned revenue growth. Consequently, the true strength of the economy will have to come to the forefront.
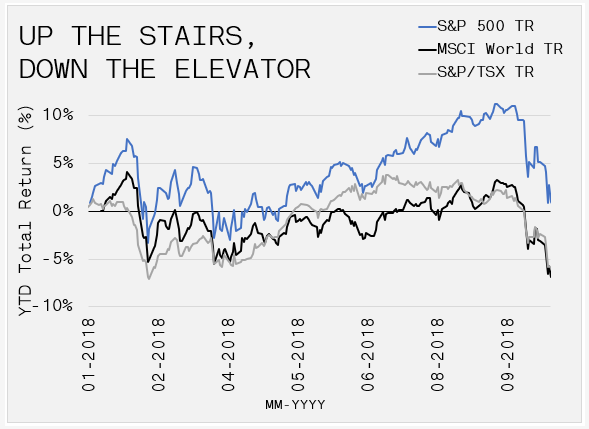
Offsetting equity weakness, traditional protection mechanisms acted as-expected during the month, as the US 10-year bonds strengthened, and gold finally caught a bid. Gold was up 3.4% during the month, while the US 10-year yield has come back from 3.25% to 3.08%. Also pressuring longer-term yields was a weaker-than-expected US GDP print. It was revealed that government spending and inventory building was responsible for growth, rather than strong consumer demand.
Oil stumbled during the month, with WTI oil prices leaking by 11.5%. We commented previously on the incredible long bias in oil markets over the past few months. Though it is impossible to time when market positioning can reverse, the sensitivity to downside moves was witnessed in October. The backdrop for bullish sentiments was the combination of US sanctions on Iranian exports (effective 04-Nov-18) and persistent turmoil in Saudi Arabia. However, worries about slowing global GDP growth and Russian comments regarding maintaining production, were the catalysts for the recent selloff. Whether its oil or any other market, this month’s move shows that while timing a reversal is often futile, reducing exposure is ever-important when a good run becomes tired.
Beyond long-term rates, Central Bank maneuvers on both sides of the North American border had large implications on the short-end of the yield curve. Following the US Federal Reserve’s 25bp increase on 26-Sep-18, Canada followed-suit in October. Governor Poloz signaled confidence in the economy with a 25bp increase in the benchmark rate, which now rests at 1.75%. The removal of uncertainty around the revised trade agreement with the US and Mexico was also declared as a reason for rates to rise towards the stated neutral rate of 2.5% to 3.5%. Even though rates remain at historically low levels, the consumers’ capacity to withstand sequential rate increases is questionable due to household debt levels in Canada. A recent Bloomberg article cited that Canadian household credit growth was 3.6% in September year-over-year, the slowest since 1983 and below the 8.1% historical average. While the data is only representative of one month, it could indicate that Canadians are unable to add incremental leverage at higher interest rates. Now more than ever, credit growth acts as a primary indicator of GDP strength so it will be interesting to observe the data point’s impact on the Canadian economy and the prospects for further rate increases.
The Bank of Canada and its Governor, Stephen Poloz, carry out monetary policy by raising and lowering the target for the overnight rate. In the US, the Federal Open Market Committee has similar responsibility. However, there is a growing impasse between President Trump, Fed Members such as Neel Kashkari of Minneapolis and the Federal Reserve. Those who oppose the Federal Reserve are lobbying for a pause in rate hikes and less monetary tightening. Low borrowing costs are needed to help prolong the growth cycle, especially since the Trump administration has already used its primary bullets (tax cuts and relaxed regulations) in the middle of midterm elections. This internal conflict will be an extra source of volatility as the world economy plateaus.
October 01, 2018
2018-19 Preseason Primer
Feature Topic
The 2018-19 NHL regular season schedule will commence on 03-Oct-18. To make certain players are fiscally prepared for the upcoming campaign, GAVIN Hockey Wealth Specialists have once again updated The Preseason Primer. The infographic below provides current and relevant financial data for the 2018-19 season; including the highest paid players after-tax, pay periods, escrow history, c...
The 2018-19 NHL regular season schedule will commence on 03-Oct-18. To make certain players are fiscally prepared for the upcoming campaign, GAVIN Hockey Wealth Specialists have once again updated The Preseason Primer. The infographic below provides current and relevant financial data for the 2018-19 season; including the highest paid players after-tax, pay periods, escrow history, currency forecasts and players’ group benefits. Feel free to share The Preseason Primer!
October 01, 2018
A Closer Look at Technology Stocks
Third Quarter 2018 Newsletter
Interest Rates Rise Amid Geopolitical Risks – Markets had a lot to digest over the past three months as trade tensions grew, NAFTA negotiations reached a resolution and European stability was again tested in Italy. Global growth remained solid as the U.S. economy forged ahead posting 4.2% real GDP growth. As a result, the yield curve in the U.S. shifted over 20 basis points (0.2%) hig...
Interest Rates Rise Amid Geopolitical Risks – Markets had a lot to digest over the past three months as trade tensions grew, NAFTA negotiations reached a resolution and European stability was again tested in Italy. Global growth remained solid as the U.S. economy forged ahead posting 4.2% real GDP growth. As a result, the yield curve in the U.S. shifted over 20 basis points (0.2%) higher and the 2-year note touched its highest level since 2008.
New rounds of tariffs between the U.S. and China did little to impact the S&P 500 which set new highs over the third quarter, appreciating 7.7% . The Canadian stock market, measured by the S&P/TSX, under-performed its peers in the third quarter falling nearly 1.5% due to flat oil prices and a widening discount to Western Canadian Crude.
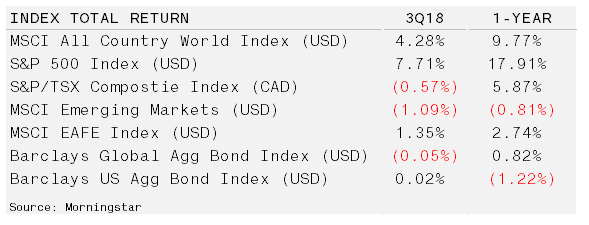
Technology Stocks Are Breaking Down – The US equity market has fallen nearly 10%, twice in 2018. While these types of pullbacks, labelled as corrections, happen on an annual basis, the market leaders are now beginning to show some weakness. Seven big technology leaders – Amazon, Nvidia, Apple, Microsoft, Facebook, Alphabet and Netflix – have contributed more than half of the 60% increase in the S&P 500 since the end of 2013. The parabolic advance that began, ironically during the taper tantrum, appears to have been broken. If this sell-off continues there is a high probability that it manifests into greater losses for the broader market.
Over the last six to eight months there has been growing backlash against data collection and privacy violations by the technology giants. Mainstream media sounded off about the violations following news that Facebook shared user data with Cambridge Analytica. This data was then allegedly used to influence voters in the US presidential election. Lawmakers summoned Facebook CEO, Mark Zuckerburg to appear before congress for questioning. However, the hearing turned into a side-show as Senator’s displayed a clear lack of understanding of Facebook’s operating model.
The Facebook business model, which centers around data collection, has allowed the company to capture nearly 20% of US digital ad spending. Meanwhile its main competitor, Alphabet, garners nearly 40%. The duopolistic nature of the digital add industry is not a one-off. Alphabet and Apple provide 99% of mobile operating systems while Apple and Microsoft supply 95% of desktop operating systems. This has formed a far different fundamental environment for technology shares than the market’s experience during the dot-com bust (2000-2003).
Historically low interest rates combined with dominant market positions have propelled technology earnings. Unlike the dot-com era, technology firms today possess strong fundamentals, revenues and earnings rather than speculation. Going forward, analysts project the five biggest US tech companies—Apple, Alphabet, Microsoft, Amazon and Facebook, which account for 44% of the Nasdaq index—will see their profits grow to $170 billion and cash holdings reach $680 billion by 2020. This implies an average forward P/E ratio of 20x, which is reasonable given their growth especially when considering that Amazon is an outlier.
However, antitrust has also become one of the major focal points. And, Europe appears to be leading the charge on the regulatory side. Alphabet was hit with a record-breaking $5 billion fine by European Union (EU) regulators for alleged anti-competitive Android bundling. The EU is also addressing data and privacy with its General Data Protection Regulation (GDPR) rules. The antitrust backlash has led to numerous calls to beak-up the likes of Facebook, Google and mostly Amazon. Amazon is the most unique case as the company has essentially disrupted every industry in which it has become involved.
Jumping into large technology names following their massive price ascent should be approached with position sizing and timeframe top of mind. The firms are currently generating strong growth and have solid earnings however the environment appears to be changing. More importantly perhaps, these market generals have become increasingly important to the broad market indexes. Therefore, it stands to reason that further weakness here could make for a more difficult equity environment in general.
September 28, 2018
Solid US Stock Gains Among Rising US Bond Yields
Market Recap & Box Score
The MSCI World and S&P 500 recorded solid gains in September, rising 0.8% and 0.6%, respectively, while the TSX lagged with a 0.7% drop for the month. Financials performed well in Canada following strong third quarter earnings, but weak gold (down 1.0%), NAFTA trade concerns and relative underperformance of Canadian Western Select Oil hurt the energy sector. Commodities in general...
The MSCI World and S&P 500 recorded solid gains in September, rising 0.8% and 0.6%, respectively, while the TSX lagged with a 0.7% drop for the month. Financials performed well in Canada following strong third quarter earnings, but weak gold (down 1.0%), NAFTA trade concerns and relative underperformance of Canadian Western Select Oil hurt the energy sector. Commodities in general were positive during the month as the Bloomberg Commodity Index rose 2.0%. Emerging Markets, reflected by iShares MSCI Emerging Markets Index (EEM) on the NYSE, caught a bid and stabilized after a 3.4% drop in August.
Oil continues to be a tale of two tapes – the main indices (Brent or WTI) versus Canadian Western Select. WTI and Brent were boosted during the month when OPEC commented that production would not increase to offset reductions from Iranian sanctions and Venezuelan turmoil. The decision came despite Trump’s Twitter plea for OPEC to expand supply. Given the military protection that the US provides to the Middle East, Trump declared that lower oil prices should be the implicit compensation. It is questionable whether civilians residing in Yemen, Iran, Iraq or Syria are enthusiastic about the US presence in their country. But politics aside, the US is expected to maintain hostile oil price rhetoric as the economic expansion enters the final innings. Western Select continues to lag as no progress is made on pipelines to move the product. Western Select registered a 14.1% drop in September as WTI prices were boosted by 3.8%. These movements brought the price differential between the two to $35.50, a 49% discount. Correspondingly, Canadian producers are being clobbered and a major factor in the TSX’s weakness during the month.
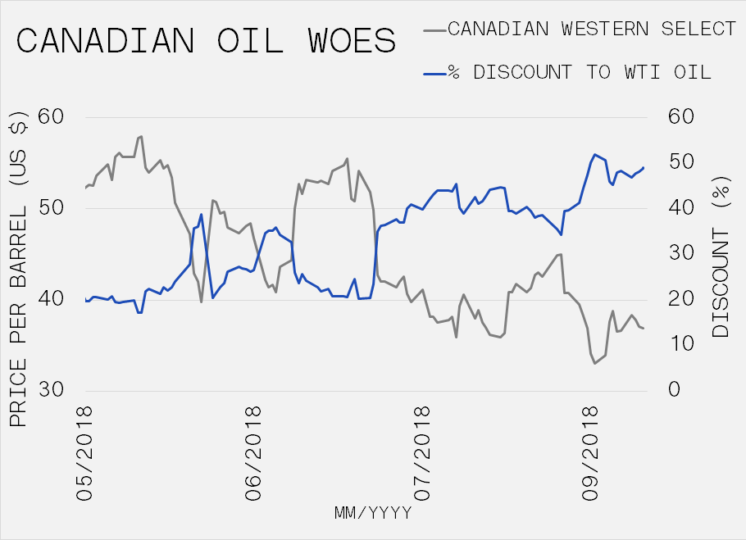
The 30-year US Treasury Bond yield matched the May 2018 highs and moved decisively above 3% to 3.25% in September. The US Federal reserve not only increased the discount rate at their scheduled meeting, but they ratcheted-up the target range of the Federal Funds Rate to 2-2.5%, signaled one more hike in December and three lifts in 2019. The 2 and 10-year yields also continue to rise, with the 2-year at 2.8% (up 89bps from Jan-19) and the 10-year at 3.1%. Yields ticked up into and on the news of the Federal Reserve decision but have since moderated. Beyond the news flow, it is interesting to monitor Treasury pricing in the context of the Federal Reserve’s initiative to shrink their balance sheet. The third quarter marked a planned increase in the amount of securities the Fed planned to roll off their balance sheet, up to $50 billion per month. The yield on the 30-year Treasury has risen considerably since this time, and a similar move can be observed in the 10-year. Uncertainty about the future is often an explanation for rising yields. The anticipation of large budget deficits, over supply of Treasuries, trade wars and tariffs promote uncertainty.
We will reference President Trump to summarize the current impasse in NAFTA negotiations. The President’s recent comments include the country’s displeasure with the Canadian negotiating style and a claim that he refused a one-on-one meeting with Prime Minister Trudeau. As negotiations are extended, concerns linger around issues such as trade dispute mechanisms and dairy, casting doubt on the Canadian dollar and certain sectors within the country, particularly auto parts manufacturers and lumber producers. Producers have repeatedly used the World Trade Organization trade dispute process to address anti-dumping complaints from the US and if the mechanism is altered, this could impact exports into the US, especially without a new Softwood Lumber Agreement in place.
September 06, 2018
The Explosive Growth of eSports
Feature Topic
eSports are organized video game competitions where the participants are professional gamers. And, the sport is booming. Forecasts suggest that revenue will exceed US$1 billion as early as 2019. While that figure may not approach the US$14 billion that was generated by the NFL in 2017, the global eSports audience is expected to reach 380 million in 2018. The audience consists of 165 m...
eSports are organized video game competitions where the participants are professional gamers. And, the sport is booming. Forecasts suggest that revenue will exceed US$1 billion as early as 2019. While that figure may not approach the US$14 billion that was generated by the NFL in 2017, the global eSports audience is expected to reach 380 million in 2018. The audience consists of 165 million enthusiasts and 215 million occasional viewers. To put that into perspective, Super Bowl LI broadcasted by NBC in February 2018 had a viewership of 103.4 million. The popularity of eSports has even garnered the attention of the IOC, who is openly considering adding the competition as a demonstration sport for the 2024 Olympic Games in Paris. Click the link below to view more eSports facts and figures.
August 29, 2018
Repeating Themes Push Markets Higher in US and Canada
Market Recap & Box Score
Tariff talk once again helped boost the S&P 500’s relative performance versus global equity benchmarks. With a 3.1% gain in August, the S&P 500 outpaced both the MSCI World (1.0%) and TSX (0.8%). The MSCI World Index was affected by relative weakness in emerging markets and Europe; excluding the US, the index was down 1.1%. Softness in foreign markets was driven by US dollar (...
Tariff talk once again helped boost the S&P 500’s relative performance versus global equity benchmarks. With a 3.1% gain in August, the S&P 500 outpaced both the MSCI World (1.0%) and TSX (0.8%). The MSCI World Index was affected by relative weakness in emerging markets and Europe; excluding the US, the index was down 1.1%. Softness in foreign markets was driven by US dollar (USD) strength to begin the month, as the DXY was up 2.2% and MSCI World down 3.7% through 15-Aug-18.
The USD has been buoyed by several factors; (1) rising interest rates in the US are diverging from the rest of the world, (2) tariff and protectionist policies, (3) shortage of USD overseas. The robust USD environment affects emerging market economies who have large US dollar debt service obligations and those that need to import USD-priced inputs and services. Europe also weakened due to Turkey’s political spat with the US that led to worries about sanctions and the impact on the country’s banking system. In addition, concerns in Italy continue to mount. Moody’s extended its review of the country’s bond rating and rumours suggested that Italy would seek additional ECB support to purchase its bonds. In Canada, a relatively benign commodity environment helped to suppress the TSX. Within commodities, oil registered positive results, rising 3.1% following a weak July, while gold and silver both were down. Gold’s woes have lingered for more than 6 months, dropping 11% from its high of $1,345 in February 2018. The US 10-year Treasury yield took a step back during the month, dropping 9bps to 2.87%, while the spread between it and the 2-year narrowed to 21bps.
NAFTA has been prominent in Canadian headlines. President Trump announced his intention to enter into a new bilateral US-Mexico trade agreement, which indirectly applies political pressure on Canada to succumb to US trade demands. Canada’s Minister of Foreign Affairs, Chrystia Freeland, has been in lengthy discussions with US representative, Robert Lighthizer, despite Trump’s posturing. Ms. Freeland’s history opposing Russian oligarchs helps provide some insight into her ability to withstand political pressure and bullying tactics.
After a slow first half in 2018 and many cutting their losses in cannabis, a mid-August announcement from Constellation Brands suddenly sparked a rally that helped lift the sector 24% for the month. Constellation Brands (NYSE:STZ), sporting such brands as Corona and Modelo, followed an earlier $200 million investment in Canopy Growth Company (TSE: CGC) with a follow-on $3.8 billion investment. As part of the transaction, STZ will nominate four directors of the seven-member board, which allows the company control over CGC. Later, news broke that global spirit powerhouse Diageo (NYSE: DEO) was evaluating a potential investment in the space, helping to add fuel to the speculative fire. Many are now identifying names such as Pepsi, to Big Tobacco as potential acquirers in the future. The potential for M&A has, for the time being, caused prices and volumes to spike across the space and BNN Bloomberg to focus much of their attention on the topic. A constantly changing regulatory environment and greater disclosure on the medical benefit will inspire Big Pharma to enter the market. A joint research project between a Washington, DC based data analytics firm and London UK biotech firm reported that 7 of Canada’s top 10 cannabis patent holders are major multi-national pharmaceutical companies. With valuations in Canada already sky-high, either fundamental performance, or additional M&A will be needed to keep things moving.
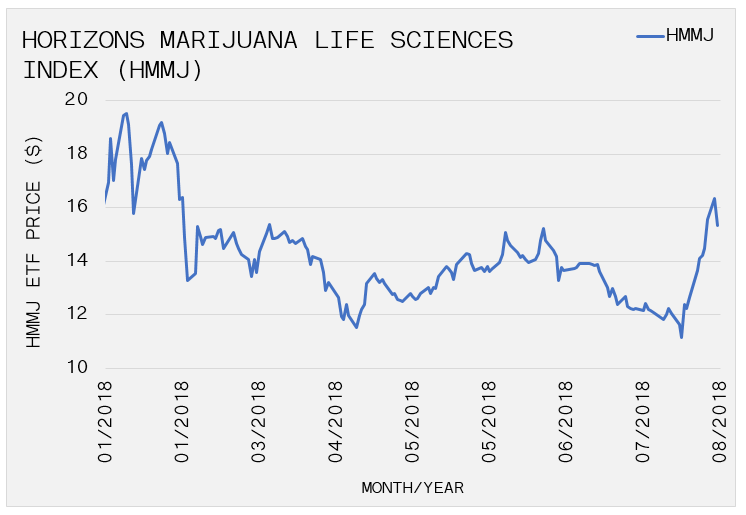
August 03, 2018
Getting to Know the Better Half
Feature Topic
The role of family, and particularly the spouse, is often overlooked when a player achieves success. Truthfully, a strong and supportive partner is essential for an athlete to achieve their on and off-ice dreams. Similar to the player themselves, the better-half needs to be disciplined, persistent, diligent and organized … not to mention patient and selfless. GAVIN spoke with Shannon ...
The role of family, and particularly the spouse, is often overlooked when a player achieves success. Truthfully, a strong and supportive partner is essential for an athlete to achieve their on and off-ice dreams. Similar to the player themselves, the better-half needs to be disciplined, persistent, diligent and organized … not to mention patient and selfless. GAVIN spoke with Shannon Tucker and Lauren Giordano to gather some insights on their experience as the wife of an NHL hockey player. Click below to read what they have to say!
August 01, 2018
Facebook & Precious Metals Dive while Indexes Thrive
Market Recap & Box Score
Sustained strength in equities was offset by overall commodity weakness in July. The S&P 500 led the way, up 3.3% for the month, with Consumer Staples finally catching a bid. Technology shares were the frontrunners, as early gains compensated for company-specific weakness later in the month. The MSCI World Index only slightly trailed with a 2.9% gain, while the TSX was dragged dow...
Sustained strength in equities was offset by overall commodity weakness in July. The S&P 500 led the way, up 3.3% for the month, with Consumer Staples finally catching a bid. Technology shares were the frontrunners, as early gains compensated for company-specific weakness later in the month. The MSCI World Index only slightly trailed with a 2.9% gain, while the TSX was dragged down by weak oil to finish the month up 1.2%.
While earnings season started very strongly, some unlikely names changed the narrative in the final two weeks of trading. First, Netflix reported less than expected subscriber growth, ending the month down 16% in the final two weeks. Next, Facebook was down a cumulative 21% since it reported its lowest quarter-over-quarter user growth since 2011. Some shrugged off recent negative press related to such events as Cambridge Analytica or advertisers looking to reduce social media spending. However, with stalled user growth for four consecutive quarters, fears of a growth plateau are building. It remains questionable that the company reports that half of all Americans and Canadians, including infants and seniors, use Facebook on a daily basis. But, assuming this is correct, Facebook and its investors may need to start adjusting assumptions of continued growth in its userbase. The company’s ability to innovate is second-to-none; so, by no means is this story complete. Twitter, although less of a darling, also reported slower user growth than the market expected, losing over 25% of their market cap since 26-Jul-18. Despite these large misses, overall earnings have been positive. Nevertheless, the negative reaction to quarterly earnings misses by tech leaders causes one to reflect on the proximity of a bear market.
We would be remiss if we did not at least mention tariffs during a 2018 monthly commentary. As the US pursues the America First policy, some countries caught on the other end of President Trump’s tweets have decided to work together to try to offset some of the impact. Most important to Canadians, is the nation’s union with Mexico, Japan, South Korea and the EU to address tariffs on vehicles and vehicle parts exported to the US. The US has cited threats to National Security as reasons to justify tariffs on these goods. Warning of tariffs up to 25% will surely add a significant amount to the price of vehicles. We continue to question the impact this would have on the American consumer, but it seems like voters are supportive of an aggressive President who will continue to beat the drum to encourage the momentum.
2018 has not been good to either silver or gold, with both losing their luster through the first half of the year. It is clear that the popular US Dollar and the prospects for rate increases have produced much of the weakness. A rising Federal Funds Rate makes the relative attractiveness of yield-bearing instruments greater than that of gold. However, an absence of movement on longer-term yields reflects the bond market’s feelings towards the Fed’s ability to continue to raise rates. Further, an uneasy European political situation and the steady drumbeat of the inflation narrative all point to a potential opportunity for precious metals. While the USD, as measured by the DXY, takes a pause on its year-to-date uptrend, it seems gold and silver have both stabilized at their current levels. Certainly based on current correlations the US Dollar Index (DXY) should be the primary determinant of the next move for bullion prices, but opportunities are brewing for outside influences to start providing a tailwind.
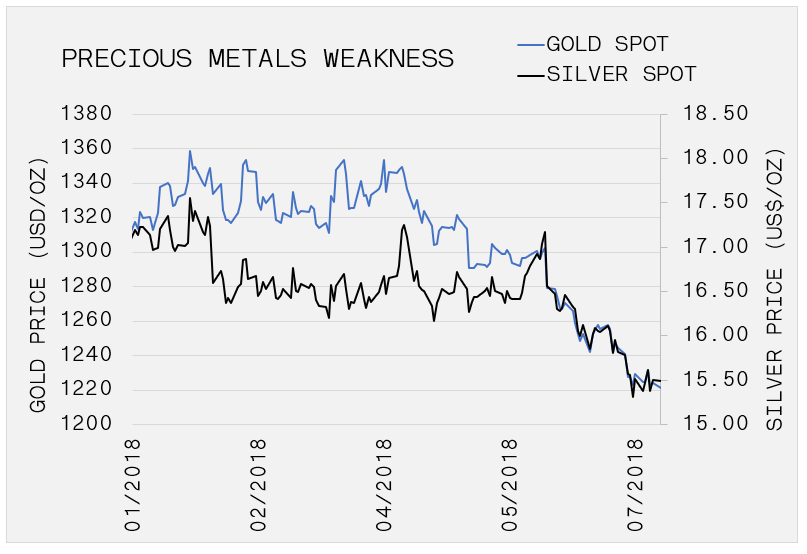
July 12, 2018
Professional Hockey Players Invest in Cannabis-Based Medical Solution
GAVIN Hockey Wealth Specialists aligns with NY-based CB1 Capital Management
GAVIN Hockey Wealth Specialists, a wealth management and advisory firm for NHL athletes is teaming up with CB1 Capital Management LLC. CB1 invests in the supply chain of cannabinoid-based wellness solutions, products and therapies that address a wide range of unmet medical conditions and use-cases. “Professional athletes understand the conundrum of modern-medicine,” stated Todd Harris...
GAVIN Hockey Wealth Specialists, a wealth management and advisory firm for NHL athletes is teaming up with CB1 Capital Management LLC. CB1 invests in the supply chain of cannabinoid-based wellness solutions, products and therapies that address a wide range of unmet medical conditions and use-cases.
“Professional athletes understand the conundrum of modern-medicine,” stated Todd Harrison, Founding Partner and Chief Investment Officer of CB1 Capital Management. “Cannabinoid wellness has shown tremendous promise in addressing indications ranging from pain relief to traumatic brain injury (TBI) without the adverse effect profile of conventional treatments.”
GAVIN’s first-hand knowledge of professional sports creates a strong alignment with the focus of CB1 Capital Management.
“As a former player, I am very familiar with the solutions that are used to address aches, pains and injuries. Accordingly, we also understand the need for novel and progressive medical treatments.” said Stew Gavin, President of GAVIN Hockey Wealth Specialists, “We believe this is an opportunity to support the research and development for these therapies and to align the best interests of our clients and investors with potentially safer and more efficacious solutions for professional hockey players.”
A seven-year study published in 2011 by the Canadian Medical Association Journal tallied a total of 559 concussions over seven NHL regular seasons; that’s 4.6 to 7.7 concussions per 100 NHL players per season. Those numbers are tame compared to American football; a 2017 study found that 99% of studied NFL brains were diagnosed with CTE.
CB1 Capital Management does not touch the cannabis plant. Investment verticals include cultivation & dispensaries, biopharmaceutical applications, GMP compliant labs, industrial hemp & farming, extraction & nutraceuticals, pet foods & supplements, and more.
About GAVIN Hockey Wealth Specialists
Based in Toronto, Gavin Management Group, Inc. (“GAVIN”) is an SEC registered investment adviser. Through its planned-approach to financial independence, GAVIN has been working to create and sustain long-term financial success for professional hockey players since 2003. Please visit www.gavingroup.ca for more information.
About CB1 Capital Management, LLC
Based in Port Washington, NY, CB1 Capital Management, LLC is an investment adviser that invests in securities of public companies in the cannabinoid-wellness space.
Important Note
This material is provided for informational purposes only and does not constitute a personal recommendation by GAVIN and/or CB1 to you. Nothing contained in this release is intended as a solicitation to invest.
July 09, 2018
GAVIN Special Opportunities Fund
New fund launched and now open to investors!
Over the past year, we endeavoured to partner with two industry leading investment managers to provide a unique opportunity for our clients. The primary motivations that inspired us to undertake this mission were as follows. To provide return enhancement potential when the historic equity bull market falters; and, To participate in the economic benefits that will arise from the appli...
Over the past year, we endeavoured to partner with two industry leading investment managers to provide a unique opportunity for our clients. The primary motivations that inspired us to undertake this mission were as follows.
- To provide return enhancement potential when the historic equity bull market falters; and,
- To participate in the economic benefits that will arise from the application of cannabinoid-based drugs to treat epilepsy, brain cancer, dementia and a host of other diseases.
Accordingly, in July 2018, we launched GAVIN Special Opportunities Fund and made our initial investments in Horseman Global Fund and CB1 Wellness Fund LP.
CB1 Wellness Fund is a cannabis-focused hedge fund operating from New York. Portfolio holdings are focused on cannabinoid-based solutions and biopharmaceutical applications and therapies. Prior to his work with CB1 Capital, founding partner and chief investment officer, Todd Harrison spent almost three decades on Wall Street managing risk and researching financial market strategies. He was also the founder and CEO of Minyanville Media Inc., an Emmy-winning financial media company covering global markets in real time.
Based in London, England, Russell Clark has been managing Horseman Global Fund since February 2001 with a distinct and unparalleled strategy. Uncommon investment opportunities are identified by focusing on breakdowns in correlations. Historically, this approach has delivered results that are not synchronized with broad equity markets. For example, during the financial crisis from October 2007 to March 2009, when the S&P lost more than 50%, Horseman Global returned over 35% to its unitholders. Since the fund’s inception, investors have earned an annualized return of 10.75% (as of 30-Apr-18).
For more information on this exciting investment opportunity, please click the link below to view profile page.
Important Note
This material is provided for informational purposes only and does not constitute a personal recommendation by GAVIN. Nothing contained in this release is intended as a solicitation to invest.
July 01, 2018
It’s About Getting Well
Second Quarter 2018 Newsletter
Markets Make Their Comeback – After a volatile 1Q18, developed markets regained their upward trajectory in the second quarter. Although, headlines related to trade wars and weakness in emerging market caused brief pullbacks, every selloff seemed to create a bid. Entering the third quarter, markets may find more momentum in corporate earnings or become vulnerable to tariffs and rising ...
Markets Make Their Comeback – After a volatile 1Q18, developed markets regained their upward trajectory in the second quarter. Although, headlines related to trade wars and weakness in emerging market caused brief pullbacks, every selloff seemed to create a bid. Entering the third quarter, markets may find more momentum in corporate earnings or become vulnerable to tariffs and rising interest rates.
Following the most recent Fed interest hike in March, Fed Chair Powell indicated to Congress in July that they would continue to raise rates. In addition, the Bank of Canada raised its benchmark by 25bps to 1.5% and are expected to follow-suit with the US. Short-term yields have risen accordingly, but the 10- and 30-year yields continue to hold steady. This has the potential to invert the yield curve, often seen as a harbinger of recession. However, with the continuation of quantitative tightening and the increased issuance of longer-dated bonds in 2H18, eventually the US government will be forced to pay higher interest on its tragic debt piles. Accordingly, higher long-term yields needed to keep a positive curve are conceivable.
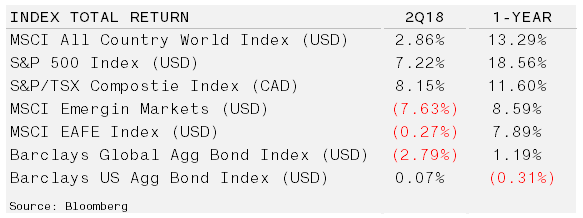
Cannabis Prepared to Enter the Limelight – The impending Canadian Federal recreational legalization on 17-Oct-18 represents a sea change in governmental attitudes towards cannabis. Numerous studies are broadening the momentum as the efficacy of cannabis’s abundant active ingredients are being emphasised. The plant’s benefits are being proposed as therapy for epilepsy, cancer, autism, schizophrenia, concussions, Alzheimer’s, Crohns, depression and more.
During 2Q18, GW Pharmaceuticals (NYSE: GWPH) announced FDA approval for their childhood epilepsy drug, Epidiolex, the first such approval of its kind. The next step to availability in the US will be rescheduling of Cannabidiol (CBD), the active ingredient. Currently cannabis carries Schedule I classification under the Controlled Substances Act, indicating high potential for abuse and no medical purpose.
Rescheduling carries with it many potential medical implications. First and foremost, lifting restrictions on the supply of cannabis will allow researchers to pursue medical testing. With the ability to test and discover new medical benefits, the opportunities for medical applications grows exponentially, and with it the investment thesis. Second, it should help increase public support for cannabis which continues to grow, as evidenced in the political universe. Cannabis’s popularity among groups as varied as military veterans and parents with sick children provides significant political motivation with US mid-term elections in November. Further, its prospective economic impact is difficult to ignore, as is its potential as an offset to the opioid epidemic.
Of course, it is important to evaluate both sides of an investment argument, and no doubt supply and demand will eventually rule out. Estimates for Canadian cannabis consumption seem overextended, which has helped extend the valuations for Canadian-listed equities. In addition, increased research will not exclusively focus on the benefits of cannabis. New and potential negative side effects will also become uncovered.
As always, it is critical to understand the industry and the competitive landscape of a targeted investment. Moreover, determining a valuation that provides a suitable margin of safety at which to invest requires complex financial models. Even small changes in a few variables can alter an outcome enormously. For a new sector, where regulations are evolving, and forecasts for demand are largely promoted by persons with a vested interest – the uncertainty for fundamentally predicting results is immense.
In summary, we have no doubt that opportunities in this budding sector are incredibly promising. But, we are very cognizant of the optimistic assumptions currently being used to justify some company’s valuations. The Horizons Marijuana Life Sciences ETF (TSE: HMMJ) has fallen 33% since its peak in January 2018. Investing is not for the impatient, and this story should be no different.
[1] “It’s About Getting Well”, Todd Harrison, Chief Investment Officer of CB1 Capital Management
June 27, 2018
Oil, Cannabis, Emerging Markets & More
Market Recap & Box Score
June mirrored May as far as equity markets were concerned with the TSX again leading (+2.5%) the way on the back of oil strength. The S&P 500 and MSCI World Index registered gains of 0.1% and 0.4% as we enter Q2 reporting season. More than 200 domestic Chinese stocks were included in the MSCI World Index beginning in June. However, it wasn’t a promising start, as both the Shanghai...
June mirrored May as far as equity markets were concerned with the TSX again leading (+2.5%) the way on the back of oil strength. The S&P 500 and MSCI World Index registered gains of 0.1% and 0.4% as we enter Q2 reporting season.
More than 200 domestic Chinese stocks were included in the MSCI World Index beginning in June. However, it wasn’t a promising start, as both the Shanghai and Shenzen stock exchanges officially entered a bear market during the month, falling over 20% from their January highs. Trade tariffs and the slide in yuan have been popular reasons to justify the decline, but it is hard to overlook Chinese banking regulator’s clampdown on Rmb 13.8Tr (USD 2.13Tr) of entrusted lending business. These loans are often made by shadow banks and the restriction specifically prevents them from being used to buy equities, bonds, or derivatives by the borrowing company.
Oil once again experienced increased volatility. The 22-Jun-18 OPEC announcement provided a tailwind to the commodity, rising 11.2% in the final five trading days prior to 27-Jun-18, ending the period with a 6.8% gain. Energy’s weight in the TSX is almost 20%; as such, the benchmark’s outperformance is largely attributed to the sector. The main catalysts for oil were the anticipated sanctions on Iran (cut off supply) and the announcement of a lower-than-anticipated combined production increases from OPEC and Russia. Fundamentals were further confirmed when the 27-Jun-18 inventory report revealed a higher-than-expected drawdown. All this comes at a time when US oil exports reached a record 3 million barrels per days and production achieved 10.9 million barrels per day – more than any country, except Russia.
The USD continued to strengthen in June, with the US Dollar index (DXY) rising 1.3%, bringing its performance from its February low up to 7.7%. Some have cited the relative monetary policy positioning (tightening vs. loosening in EU and Japan) as the primary driver as US dollar supply shrinks. However, it may be a short-term break in a long-term downtrend. Certainly the US fiscal position should continue to weaken with Trump’s tax policy and the possibility of a massive infrastructure spend if the Republicans are successful in the November mid-term elections. Either way, Emerging Market equities have been impacted due to their reliance on USD-denominated debt. The iShares Emerging Markets ETF dropped 7.6% in June and 13.7% since the DXY hit its February low.
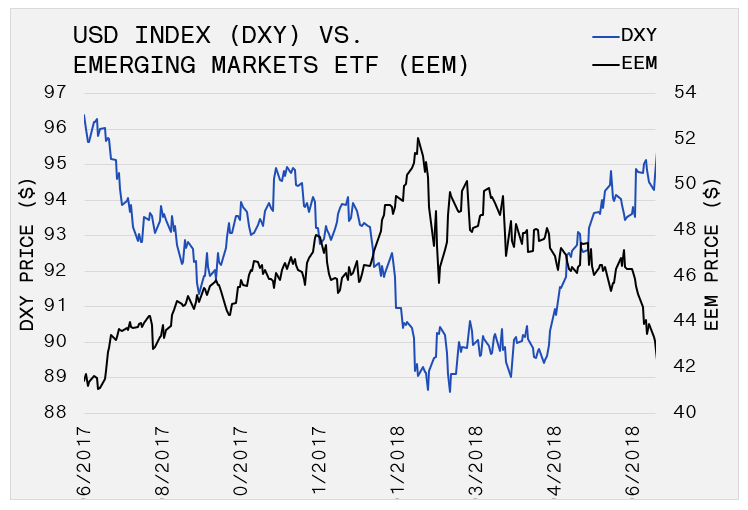
In Canada, a historic bill was passed on 20-Jun-18 to legalize the recreational use of cannabis as of 17-Oct-18, representing a sea-change in government attitudes toward the plant. Beyond the recreational side, another historic milestone was achieved with the FDA’s approval of Epidiolex, GW Pharmaceuticals’ (NYSE: GWPH) drug derived from cannabis which provides children with two rare and serious forms of epilepsy a new treatment for the disease. However, the major development will occur when the Drug Enforcement Administration’s reschedules Cannabidiol (CBD), which is anticipated within 90 days. CBD is the active ingredient in cannabis and it is currently a Schedule 1 drug, which indicates that it has no therapeutic value. Rescheduling will open the door for the ongoing testing and potential availability of treatments to address a variety of ailments, with indications ranging from epilepsy to cancer, autism, MS and schizophrenia, among others.
June 06, 2018
CBA: Fact of the Month
Article 50.11 (c): Hockey Related Revenue (HRR) Reporting Package
Within five (5) business days of a Club’s playing season being completed, but in no event later than May 15, each Club shall prepare the HRR Reporting Package and submit to the NHL’s independent accountants. Clubs that participate in the Playoffs shall provide the Playoff portion of the HRR Report within five (5) days of their final game in the Stanley Cup Playoffs.
June 06, 2018
The Hockey Wealth Specialists
Feature Topic
spe·cial·ist A person who concentrates primarily on a particular subject or activity; a person highly skilled in a specific and restricted field. When it comes to managing the financial affairs for professional hockey players, we are the Hockey Wealth Specialists. We are steadfast in our belief that financial success is achieved through a comprehensive plan. We customize these strateg...
spe·cial·ist
A person who concentrates primarily on a particular subject or activity; a person highly skilled in a specific and restricted field.
When it comes to managing the financial affairs for professional hockey players, we are the Hockey Wealth Specialists. We are steadfast in our belief that financial success is achieved through a comprehensive plan. We customize these strategies for players to make certain that their cash flow is balanced, their taxes are minimized and their families are protected. We professionally manage investment accounts in Canada and the United States to make sure your savings are working for you. And, we have the expertise, the experience and integrity that you would expect from people who have been around and in the game their whole lives. Click on the links below to learn more about GAVIN Hockey Wealth Specialists.
May 29, 2018
Political Chaos in Italy
Market Recap & Box Score
Markets continued to grind higher in May, led by North America. The S&P 500 recorded a 1.5% gain, while the TSX advanced 2.2%, buoyed by continued strength in commodity companies despite relatively flat performance of their underlying commodities. The MSCI World Index lagged, albeit with a 0.3% gain. Political turmoil and the market’s next “Exit” story stole the headlines in Europ...
Markets continued to grind higher in May, led by North America. The S&P 500 recorded a 1.5% gain, while the TSX advanced 2.2%, buoyed by continued strength in commodity companies despite relatively flat performance of their underlying commodities. The MSCI World Index lagged, albeit with a 0.3% gain. Political turmoil and the market’s next “Exit” story stole the headlines in Europe. Gold’s price movement was benign throughout the month, recording a 1% move on only one day, and ending the period down 0.5%.
Oil’s 0.3% price change concealed a volatile month, as the price plunged 7% over the final four trading days. Market participants who were long oil were spooked by Saudi Energy Minister Khalid Al-Falih’s speech in Russia, when he announced that supply caps could be scaled back and the possibility of supply increases. However, it will take a unilateral decision to enact any official supply increase out of OPEC and we anticipate continued volatility as news leaks. Markets will eagerly anticipate the results of the OPEC meeting on 22-Jun-18, while closely monitoring inventory numbers to determine whether the recent price above $60 has served to quell demand.
Volatility in equity and fixed income markets ramped up as political turmoil in Italy resurfaced another Euro-exit scenario. The Italian 10-year yield has been consistently below the US benchmark since crossing in early 2014. However, yields rose rapidly above 3% on 29-May-18 when populist Italian political parties failed to produce a new coalition government. At the same time, the US 10-year completed a 30bp retreat from its recent 3.1% high to 2.8%. While Italian credit is questionable at best, it is fairly easy to reconcile the yield differential given the European Central Bank (ECB) has purchased €341Bn of Italian bonds since 2012 and it continues to buy an additional €4Bn each month. One can also visualize the potential damage that an Italian exit could produce. We realize the risk is likely overblown, and there are constitutional hurdles present that make the result unlikely. However, we also understand the risk-reward tradeoff and continue to question whether the current 3% rate, or the 1.6% average rate since 2015 is anywhere close the reward required to compensate for the low likelihood event of potential default. With €2.3Tr of outstanding debt, a debt-to-GDP ratio of 132% and persistent political turmoil, investors are relying first on the ECB, and second on a political turnaround, to provide returns that still lag US government bonds.
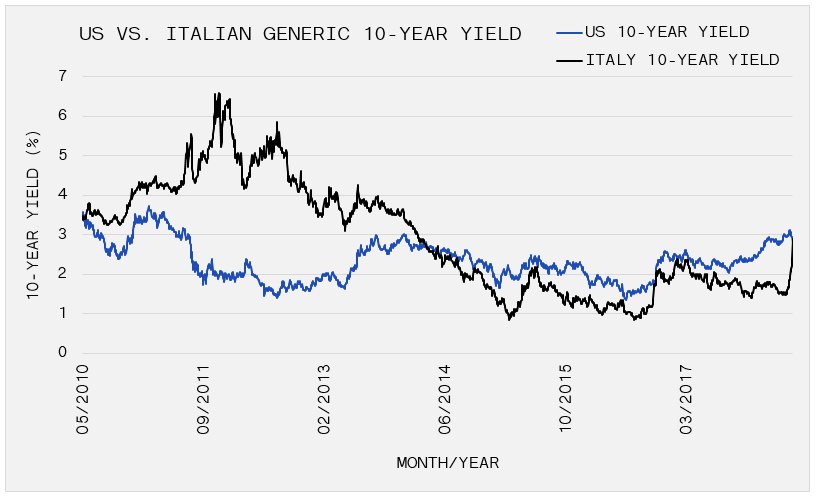
Closer to home, the Liberal government’s decision to purchase Kinder Morgan Canada Ltd.’s Trans Mountain Pipeline expansion for $4.5Bn was a last-ditch effort to save the proposal. The pipeline will extend from the oil sands of Alberta to a port in British Columbia. It would allow Canadian crude to gain greater access to foreign markets and higher prices. The project adds a much-needed 590K barrels per day of capacity from the current 300K, which will ease some of the backlog in Canadian oil markets. Canada will retain key personnel from Kinder Morgan and begin the undertaking this summer, but will actively seek a buyer for the project.
April 30, 2018
CBA: Fact of the Month
Article 20 (c): NHLPA Game Tickets
Each Club shall make available for purchase by the NHLPA up to sixteen (16) tickets per Regular Season and Playoff home games. The amount of tickets available for purchase by the NHLPA will be increased to twenty (20) tickets per game in the Conference Finals and twenty-four (24) tickets per game in the Stanley Cup Finals.
April 30, 2018
The Lucrative Lord Stanley
Feature Topic
For those competing every other night during the NHL’s second season, the total prize money for the playoff marathon has been increased by $1,000,000. The NHLPA has set aside a bonus pot of $16-million for the Stanley Cup Playoffs. Unlike other professional sports in North America, the truly unique feature is that NHL players and management decide how a club’s share is di...

For those competing every other night during the NHL’s second season, the total prize money for the playoff marathon has been increased by $1,000,000. The NHLPA has set aside a bonus pot of $16-million for the Stanley Cup Playoffs. Unlike other professional sports in North America, the truly unique feature is that NHL players and management decide how a club’s share is divided among the team members. Click the link below to learn more about playoff bonuses along with other interesting financial considerations surrounding the 2018 Stanley Cup Playoffs.
April 27, 2018
Opportunity in Canadian Oil & Gas Names
Market Recap & Box Score
The market turnaround that started in March continued into April with global markets rising in tandem. The TSX led the way again in April, up 2.0% on strong commodity performance, particularly oil, with WTI recording a 4.7% gain to follow the 5.4% gain seen in March. The MSCI World (USD) gained 1.4% and the S&P 500 1.0% as earnings season kicks off. So far, the season has been a p...
The market turnaround that started in March continued into April with global markets rising in tandem. The TSX led the way again in April, up 2.0% on strong commodity performance, particularly oil, with WTI recording a 4.7% gain to follow the 5.4% gain seen in March. The MSCI World (USD) gained 1.4% and the S&P 500 1.0% as earnings season kicks off. So far, the season has been a positive one, with 79.4% of companies that have reported exceeding estimates, according to FactSet. Oil’s move helped drive the 1.8% increase on the Bloomberg Commodity Index for the month, offsetting weakness from soft commodities dragged lower by an appreciated USD. As measured by DXY, the USD was up over 2% during the month, stemming some of the weakness that began in late 2016. Aluminum was locked into the centre of Russian-related sanction headlines. The US imposed sanctions on Russian billionaire Oleg Deripaska and several companies which he has influence on, including Rusal, the world’s second largest aluminum company by output. The prospect of such a large volume of US imports coming offline initially forced aluminum prices to their highest level in six years. However, Mr. Deripaska agreed in principal to relinquish control by selling his stake below 50%, allowing prices of aluminum to drop over 10% on 27-Apr on hopes of reduced sanctions.
Rates continue to make headlines, and this month’s breach of 3% on the US 10-year was the first time crossing of the 3% threshold since 2014 where it briefly hit 3.0% before dropping back below 1.5% in Jul-16. However, in 2014 the Fed was still actively pursuing QE and many are watching closely to see what direction it takes in the coming weeks. On the short-end, the 2-year yield adjusted sharply higher during the month to 2.5%, up 56 bps year-to-date as recent inflation and GDP data have increased investors expectations for Fed rate hikes in 2018 (up to 4). While the short- and intermediate-term rates continue to see large moves, the 30-year’s move has been more muted. At 3.1% to end the month, fixed income markets may not be convinced of the long-term growth thesis.
An interesting divergence continues to take place in Canadian oil names. While intuitively, and historically, moves in Canadian oil stocks have followed WTI fairly closely, oil’s rally to end 2017 and into 2018 has not been reflected in the stock prices of Canadian companies in that market. We wrote in Dec-17 about the widened spread between Canadian and US traded oil contracts. However, even after the spread stabilized, it was not until April that Canadian companies started to perform in line with oil, often seeing gains on days that oil saw weakness. Looking at recent price movement and the long-term trend, there may be an opportunity in Canadian oil and gas names that could benefit even if oil stabilizes here.
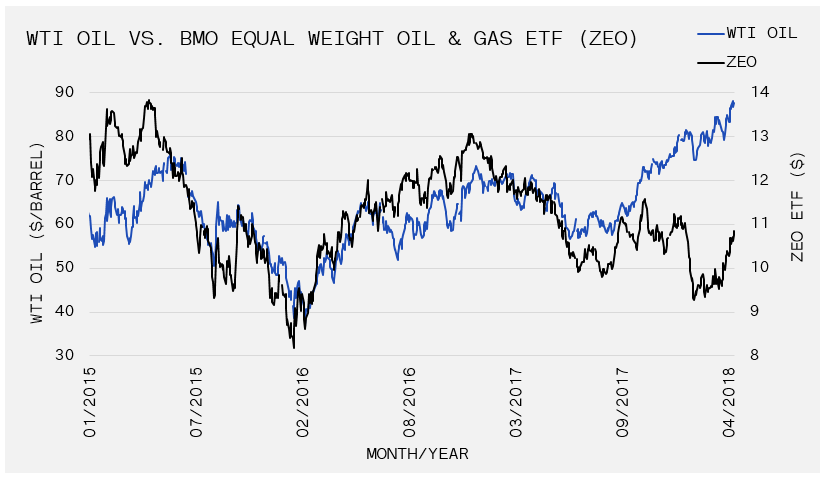
March 31, 2018
A Paradigm Shift? Inflation Narrative in Focus
First Quarter 2018 Newsletter
The Return of Volatility – Equities began the year by extending their 2017 gains. But, in late January, accumulating uncertainties and rapidly rising yields eventually pushed equity volatility up and drove prices down. Nearly all major stock and bond categories finished the period in negative territory. Following an unprecedented streak of 19 consecutive months without a 5% correction...
The Return of Volatility – Equities began the year by extending their 2017 gains. But, in late January, accumulating uncertainties and rapidly rising yields eventually pushed equity volatility up and drove prices down. Nearly all major stock and bond categories finished the period in negative territory. Following an unprecedented streak of 19 consecutive months without a 5% correction for the S&P 500, the US equity benchmark fell nearly 10% in just 10 trading days in February. A brief recovery in stocks in the latter part of February was interrupted again in March by concerns over a potential trade war between the US and China.
In March, the Federal Reserve raised rates for a sixth time since the end of 2005. Nevertheless, developed-market sovereign bond yields have remained stubbornly low until recently. As inflation began surfacing in US consumer reports, yields started to climb. The 10-year US Treasury Yield hit 2.95% in March, a level it hasn’t reached in almost 3-years, which followed the original “taper tantrum” sell-off.

Displacing Deflation from Investors’ Mindset – Inflation trends have been declining for the better part of three decades. However, the millennial year marked the flatlining of the core consumer price index. As a result, central bankers have become obsessed with raising the level of inflation beyond the 2% trend rate experienced since the turn of the century. The great financial crisis of 2009 served to intensify the fixation.
High inflation can be harmful to an economy when it is not accompanied by rising wages. Equally, low inflation can hamper corporate pricing power which restrains earnings. Accordingly, the Federal Reserve attempts to boost the long-run growth rate by exercising control over inflation, as it is transparent and linked to the health of the economy. The problem is that inflation cannot be measured by an increase in the price of one product or service, or even several products or services. Rising costs are not spread evenly between businesses and industries, which contributes to the absence of inflation in government data.
Since the early 1980s, inflation has slowed in developed economies for a variety of reasons including demographics, technological advances, M2 money supply declines and higher corporate concentration. Further, given the swath of retirees over the next decade as well as the likely displacement of jobs due to robotics and artificial intelligence, runaway inflation is an unlikely concern in the foreseeable future. It is no wonder inflation fears have become so subdued. As a result, relative to financial assets, hard assets and commodities have only been this cheap twice in the past 50 years – 1970-1972 and 1998- 2000.
So, why are we doubtful about the disregard for an inflation surprise?
- Over the last few quarters, corporate earnings reports have stated concerns about tight labor markets and emerging inflationary pressures. This is a decisive shift from the deflationary tones of 2015 and 2016. Management strategy discussions frequently involve methods to pass on price increases from materials and labour.
- China is contributing to global inflation due to increasing factory prices. Historically, China exported deflationary forces to the world with lower labour costs. Looking forward, the country is also set to deliver on right-sizing industrial capacity in sectors that were previously oversupplied; such as aluminum, coal and steel.
- A wide range of reflation-markets and related-indicators have been breaking from long-term patterns. After declining over 60% from peak-to-trough from 2014 to 2016, oil prices stabilized and are now up over 100% from the January 2016 low. Oil is a key input not only for transportation but also feed stock and plastics.
- On 02-Feb-18, the Bureau of Labor Statistics reported a 2.9% increase in average hourly earnings.
With government data now picking up the inflationary signals, bond yields quickly moved higher causing a bond sell-off. The impact was also felt in equity markets, given the potential shock higher costs would have on corporate profits. As such, investors should remain nimble and cognizant of inflation’s impact on both asset classes.
March 30, 2018
Scoring Goals & Saving Taxes
Feature Topic
As April approaches, the on-ice focus of most professional hockey players remains on their upcoming playoff push. In the player advisory world, the April tax deadlines are our version of a playoff push. Many fail to consider the complexity involved in filing taxes for a professional athlete. While some complain of federal and provincial filing requirements, an NHL athlete often has a ...
As April approaches, the on-ice focus of most professional hockey players remains on their upcoming playoff push. In the player advisory world, the April tax deadlines are our version of a playoff push. Many fail to consider the complexity involved in filing taxes for a professional athlete. While some complain of federal and provincial filing requirements, an NHL athlete often has a filing requirement in each jurisdiction in which they play. This means a typical NHL player can file upwards of fifteen tax returns! Check the link below to learn some quick facts about how an NHL athlete files their taxes.
March 30, 2018
CBA: Fact of the Month
ARTICLE 19 (e): Expense Reimbursement & Taxable Benefits
Reimbursement of expenses actually incurred (and proven) by a Player, will be excluded from a Player’s taxable income. Therefore, no Player shall be entitled to any gross-up for taxes or other charges. Players shall be solely responsible for any taxes ultimately determined to be owed, with respect to fringe benefits that they receive from their Clubs.
March 22, 2018
Trade Wars Shake Up Markets
Market Recap & Box Score
Global markets had mixed returns for the month ending 22-Mar-18. The TSX lead the way with a 1.6% gain spurred by commodities. The S&P 500 index was up 0.5% while the MSCI fared worse with a 1.4% loss as Asian markets experienced weakness. Korean automobile manufacturers were particularly impacted on trade war worries, while Japanese equities experienced Yen strength as a headw...

Global markets had mixed returns for the month ending 22-Mar-18. The TSX lead the way with a 1.6% gain spurred by commodities. The S&P 500 index was up 0.5% while the MSCI fared worse with a 1.4% loss as Asian markets experienced weakness. Korean automobile manufacturers were particularly impacted on trade war worries, while Japanese equities experienced Yen strength as a headwind during the month. On the commodity front, Oil reversed a 2.5% slide to gain 5.1% on the back of strong inventory data, while gold strengthened by 1%. As stock market volatility increased, the price of gold climbed. Gold is notoriously known as a safety asset. Accordingly, it tends to rise when there is a meaningful slump in the market. Investors often take shelter in non-yield-bearing gold as a buffer against risk. The US 10-year Treasury Yield appreciated 5bps, bouncing back over 2.90%.
Trade wars have been a constant theme weighing on markets in 2018. On 1-Mar-18, Trump announced a 25% tariff on steel imports and a 10% tariff on aluminum to help shore-up weakening domestic industries. Though Trump walked-back part of these measures as they relate to Canada and Mexico, pending final NAFTA negotiations, some have hinted at the move being a direct message to China. Chinese steel production has been curtailed dramatically for environmental reasons. This has contributed to steel exports into the US falling from 400K metric tons/month in 2014 to 60K. However, many are looking beyond this announcement to potential follow-on effects, including the announcement of an estimated US$50Bn in tariffs against China over intellectual property violations. The amount was based on estimates of economic damage caused by China through the theft of US technology and intellectual property. China has not yet made any counter-announcements, but they have hinted at retaliation. China is not the only country affected by the tariffs either, as leaders from other countries such as those in Europe have also hinted at retaliatory measures. Inflation, which has already shown signs of strength, is a notable consequence of trade wars.
We have previously commented on increased market liquidity (QE-driven) and its positive affect on markets. With the Fed embarking on a QE unwind and potential impacts of USD repatriation starting to take hold, signs of USD shortages are beginning to show. This can be seen in the US LIBOR-OIS spread, or the differential between the rate banks charge to each other to lend (LIBOR) vs. the overnight risk-free rate (OIS). With the majority of loans priced off LIBOR, a rising rate may reveal reduced USD liquidity. In turn, the willingness for banks to lend into the market may be diminished. The 55bps spread hit on 21-Mar-18 reflects the highest spread seen since the Global Financial Crisis in 2007, which is material, though the cause can only be approximated. Either way, it is something to monitor as any liquidity shortage could have pronounced implications on asset prices and credit risk/borrowing capacity in general.

February 28, 2018
Winning Streak Finally Broken
Market Recap & Box Score
During this period, market participants were reminded that the stock market and the economy are not the same thing. The US Labor Department’s January jobs report showed that 200,000 new jobs were added in the first month of 2018. Meanwhile, the historic rise in global equities came to an abrupt halt. An unprecedented streak of 19 consecutive months without a 5% correction was finall...
During this period, market participants were reminded that the stock market and the economy are not the same thing. The US Labor Department’s January jobs report showed that 200,000 new jobs were added in the first month of 2018. Meanwhile, the historic rise in global equities came to an abrupt halt. An unprecedented streak of 19 consecutive months without a 5% correction was finally broken. Following the Labor Department’s report, which also showed that wage growth jumped 2.9% year-over-year, global benchmarks fell over 7% during the next six trading days. The fear that wage growth will lead to higher inflation, and higher inflation will lead to the US Federal Reserve raising rates more quickly resulted in the S&P 500 giving back all of 2018’s gains as it entered a correction. A correction, which is a 10% pullback from a market peak, occurred on 26-Jan-18. Market corrections typically occur every other year, on average. However, the last correction for the S&P 500 was almost two years ago. Interestingly, the correction occurred less than a week after investors poured record amounts into exchange-traded funds in January.
Despite raising rates five times since late 2015, developed-market sovereign bond yields have remained stubbornly low until recently. As inflation began showing up in US consumer reports, yields started its ascent. Adding fuel to the inflation narrative, US President Donald Trump unveiled his $1.7 trillion infrastructure spending plan that will take place over the next 10-years and the US dollar depreciated nearly 15% against a basket of its key trading partners. As a result, the 10-year US Treasury Yield hit 2.92%, a level it hasn’t reached in almost 3-years, which followed the original “taper tantrum” sell-off. More significant perhaps, the equity market correction was not accompanied by rising bond prices – bonds did not act as the “hedge” that many strategies and allocation models assume.
Over the course of the last few years, many investors have abandoned traditional hedging strategies as the cost of insurance made it difficult to outperform a constantly rising benchmark. Rather, many investors tried to exploit the rising trend by selling volatility or buying inverse volatility strategies through exchange traded funds/notes (XIV Index). As a result, participants were caught off-guard and on the opposite end of the violent unwind that ensued in February. The sell-off resulted in the largest single-day point drop (not largest percentage drop) for the Dow Jones Industrial Average and wiped out nearly six years’ worth of gains for the XIV Index. More concerning for long-term investors is the outcome for these rules-based or “smart-beta” strategies, which include styles like risk parity. These strategies incorporate volatility to define the allocation of capital to different assets and rely on liquidity. A dangerous feedback loop may arise as the underlying securities can’t provide the liquidity promised by the exchange traded notes/funds as investors stampede out of the strategies.

February 28, 2018
The NHL Trade Deadline
Feature Topic
The NHL trade deadline has grown to become one of the most exciting days of the NHL season. While teams in the playoff race look to bulk-up for a late season push, teams waving their white flags seek to unload salary and acquire young assets. What many on the outside fail to consider is the immediate lifestyle changes faced by the players who are traded. To assist with this change, ch...
The NHL trade deadline has grown to become one of the most exciting days of the NHL season. While teams in the playoff race look to bulk-up for a late season push, teams waving their white flags seek to unload salary and acquire young assets. What many on the outside fail to consider is the immediate lifestyle changes faced by the players who are traded. To assist with this change, check out our Traded Player Checklist below!
February 28, 2018
CBA: Fact of the Month
Article 11.8: No Movement Clause After a Trade
If the Player is Traded or claimed on Waivers prior to their no-Trade or no-move clause taking effect, the clause does not bind the acquiring Club. An acquiring Club may agree to continue to be bound by the clause if the agreement is evidenced in writing.
January 30, 2018
The Financial Impact of the NHL All-Star Game
Feature Topic
This weekend, the NHL’s best players will gather in Tampa, Florida for the 63rd NHL All-Star Game. The fan-frenzied weekend will end with the popular 3-on-3 tournament, displaying teams from each of the four divisions all competing for a $1 million prize. As the 44 selected players prepare for the exciting event, check out our infographic providing some interesting numbers surro...
This weekend, the NHL’s best players will gather in Tampa, Florida for the 63rd NHL All-Star Game. The fan-frenzied weekend will end with the popular 3-on-3 tournament, displaying teams from each of the four divisions all competing for a $1 million prize. As the 44 selected players prepare for the exciting event, check out our infographic providing some interesting numbers surrounding the annual All-Star Game.
January 10, 2018
CBA: Fact of the Month
ARTICLE 16: League Schedule
16.15 All-Star Game
(b) The Club or NHL must provide first-class airline accommodations to any Player selected to play in the All-Star Game or otherwise requested by the League to participate in an All-Star weekend-related event.
December 31, 2017
Will The Streak Continue?
Fourth Quarter 2017 Newsletter
A Synchronized Global Recovery – Global equities experienced a near-perfect backdrop of steady global growth, low inflation and continued accommodative monetary policy in 2017, leading to strong performance. For the year, all major equity categories and sectors ended the year with double-digit gains; shaking off nuclear threats, populist uprisings and a stalled Trump Administration ag...
A Synchronized Global Recovery – Global equities experienced a near-perfect backdrop of steady global growth, low inflation and continued accommodative monetary policy in 2017, leading to strong performance. For the year, all major equity categories and sectors ended the year with double-digit gains; shaking off nuclear threats, populist uprisings and a stalled Trump Administration agenda.
Commodities closed higher on the year, led by gains in crude oil, with WTI rising 12.5%. Precious metals and copper also posted gains, while agricultural commodities were mixed. The US dollar index, which compares the greenback to a basket of global currencies, slid about 10% last year after rising for nearly three years.
Despite fears of US Federal Reserve tightening and fiscal reform leading to higher growth, most US bond indexes closed the year higher. The US yield curve, which has historically been an important indicator of recessions by inverting prior to the previous seven recessions, flattened by about 100 basis points.

Source: MorningStar Direct
Approaching Levels of Significance – The equity bull market is now deep into its ninth year, the second-longest on record. The third (and perhaps final) phase of the bull market kicked off in 2016 as global economic momentum strengthened to include more sectors and countries. The improvements were broad based as nearly every major global economy expanded in 2017. Lower corporate taxes in the US and a continuing rally in commodities bolstered the outlook for 2018.
Strategist forecast S&P 500 earnings to be between $139-$150 per share, an approximate 10.3% increase from 2017 forecasts. Similarly, the earnings multiple has increased, to nearly 18x the next four quarters’ expected earnings. The long-term average multiple is 16.5x; moreover, the multiple was 17.1x one-year ago. Statistically, a 10% setback is plausible if the Price-to-Earnings multiple backs up to 16.5x, even with a $150 earnings figure. However, at this point it appears that any pullback will be merely corrective as the emergence of a recession in 2018 is doubtful.
The ISM Manufacturing Index is often used as a guide for the business cycle. In the US, the ISM is currently experiencing the third-longest expansion in history and its reading is at the second-most elevated level in the last thirty years. Meanwhile, the Conference Board Leading Economic Indicator Index continues to increase while the US Treasury curve remains upward sloping – despite recent flattening. Given the strong economic backdrop and the need for governments to “inflate-away” their debt, we believe commodity-linked equities, including precious metals and agriculture, will outperform. Additionally, this sector is exhibiting favourable valuations.
Volatility may be resurrected in 2018. Possible triggers for spontaneous instability include;
- Failure for capital expenditures and hiring/wage increases to underpin growth.
- Excessive debt levels.
- Accelerated interest rate increases.
- Defiance to the “America First” rhetoric.
The first signs of erraticism may surface in the currency markets. A surge in the US Dollar index is likely in the near-term as tax repatriation increases demand. However, net-investment positions may trigger a USD sell-off while many countries are already seeking alternatives to the dollar system. China and Russia continue to stockpile physical gold while hinting at problems with the Eurodollar system. Meanwhile, the two countries are negotiating with Saudi Arabia for a Yuan-backed oil contract.
In the near-term, bonds are somewhat attractively priced. Originally, economic growth forecasts caused prices to slide and yields to rise. More recently, yields rose when the U.S. Senate reached a short-term compromise to end the government shutdown. The 10-year bond now sports its highest rate in over one year. Longer term, we do not anticipate traditional fixed income to benefit the portfolio from a total return perspective. Yields remain near historic lows and an increase in supply will pressure prices. Deflationary pressures have been prominent recently, as millions of baby boomers leave the workforce; but, a recent IMF research report anticipates that population aging will become very inflationary due higher health care costs. Nevertheless, bonds provide a reliable stream of income, uncorrelated performance and low-cost portfolio insurance.
Success! You have been successfully been added to the mailing list.
Subscribe
Enter your email below to receive a monthly email with the latest market and company news.
You can unsubscribe at any time.Privacy Policy
Subscribe
Success! You have been successfully been added to the mailing list.
Enter your email below to receive a monthly email with the latest market and company news.
We pride ourselves in dealing with professional athletes and protecting their information. Read more about our Privacy Policy.
You can unsubscribe at any time.
Gavin Hockey Wealth Specialists
Scotiabank Arena, 50 Bay Street, Suite 1444, Toronto M5J 3A5
416-861-1998